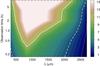
Fig. 5
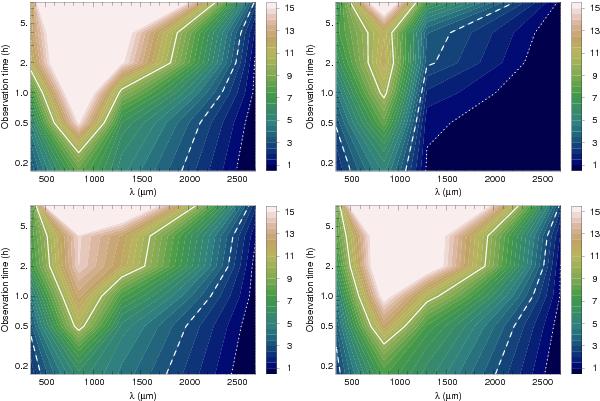
Maps of the signal-to-noise ratio in the inner (top) and outer (bottom) disks in the wavelength-integration time plane for the dynamic case, with an angular resolution of 0.10″. The S/N is computed as the median of the flux in a ring (between 0.07″ and 0.21″ for the inner disk and between 0.35″ and 0.70″ for the outer disk) divided by the rms of the background. Left: Mp = 1 MJ, right: Mp = 5 MJ. Thick dotted, dashed and solid lines show contours for S/N = 1, 3 and 10.
Current usage metrics show cumulative count of Article Views (full-text article views including HTML views, PDF and ePub downloads, according to the available data) and Abstracts Views on Vision4Press platform.
Data correspond to usage on the plateform after 2015. The current usage metrics is available 48-96 hours after online publication and is updated daily on week days.
Initial download of the metrics may take a while.