Fig. 4
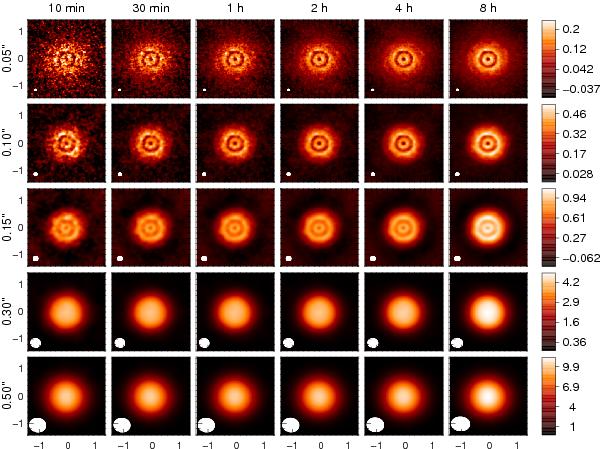
Simulated observations for the 1 MJ planet in the dynamic case at λ = 850 μm. From left to right: integration time of 10 min, 30 min, 1 h, 2 h, 4 h and 8 h. From top to bottom: angular resolution of 0.05″, 0.10″, 0.15″, 0.30″ and 0.50″ (the ALMA configuration is adapted to match the angular resolution for each wavelength). The scale on each image is in arcseconds, with the beam size represented at its bottom left corner, and the colorbar gives the flux in mJy/beam. (Note that the flux scale changes in each row, due to the different beam size.)
Current usage metrics show cumulative count of Article Views (full-text article views including HTML views, PDF and ePub downloads, according to the available data) and Abstracts Views on Vision4Press platform.
Data correspond to usage on the plateform after 2015. The current usage metrics is available 48-96 hours after online publication and is updated daily on week days.
Initial download of the metrics may take a while.