Fig. 9
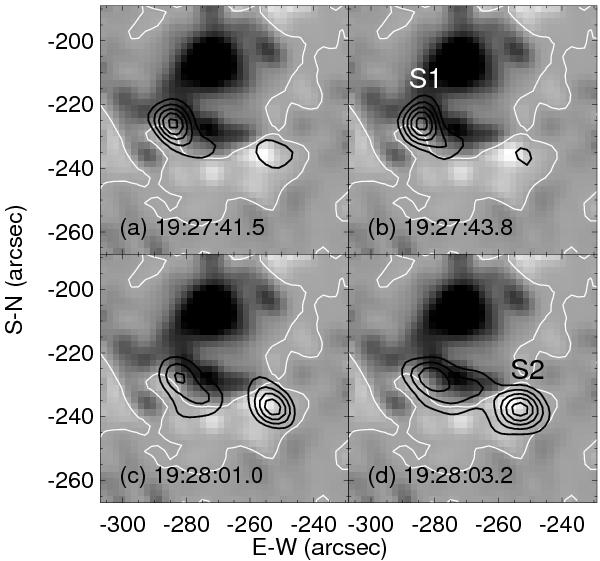
RHESSI hard X-ray clean maps (dark contours) at 25–100 keV of spikes b) S1 and d) S2 and the pre-spike underlying components (a) and c)) on 2002 March 17 superposed on the longitudinal magnetogram taken at 19:46:01.11 UT by MDI. Each map is constructed with 2 s integration. The contour levels are 0.25, 0.4, 0.55, 0.7, and 0.85 of the maximum count rates of all the images, which is 0.57 photons cm-2 s-1 asec-2. White contours indicate the polarity inversion line of longitudinal magnetic fields.
Current usage metrics show cumulative count of Article Views (full-text article views including HTML views, PDF and ePub downloads, according to the available data) and Abstracts Views on Vision4Press platform.
Data correspond to usage on the plateform after 2015. The current usage metrics is available 48-96 hours after online publication and is updated daily on week days.
Initial download of the metrics may take a while.