Fig. 8
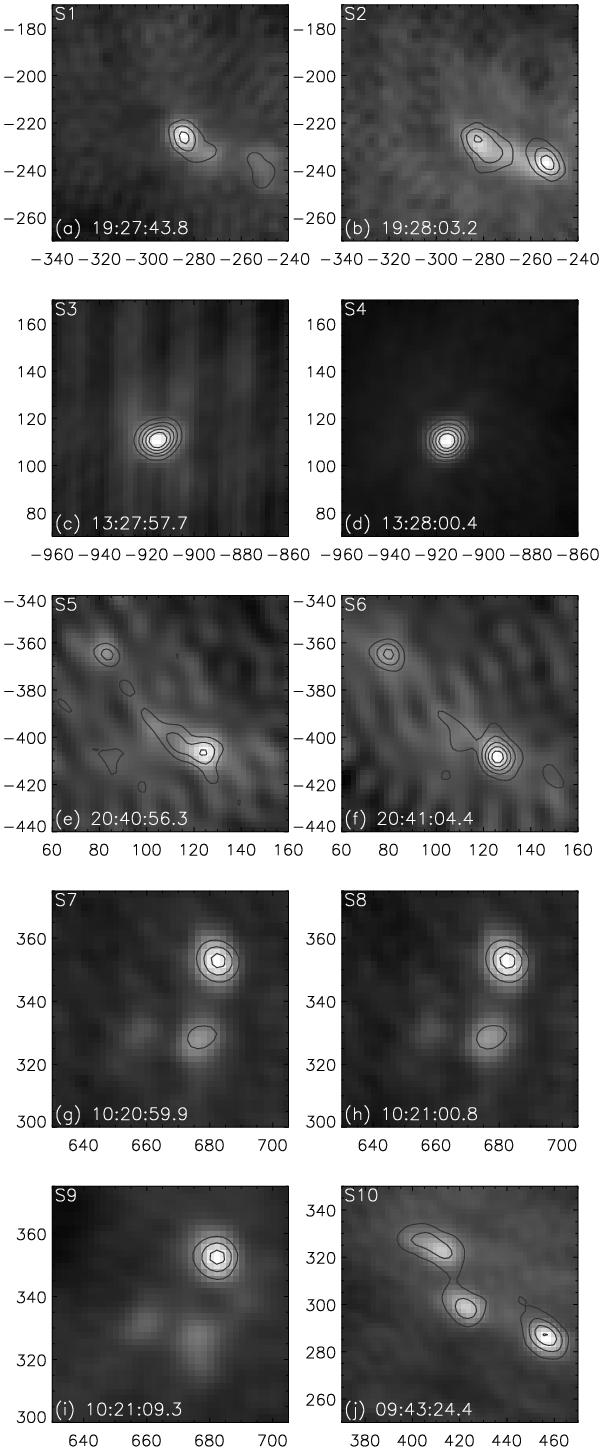
RHESSI hard X-ray clean maps at 25–100 keV of spikes S1 to S10 (gray scale) superimposed on the maps of underlying components (contours) in the same energy range. Each map is constructed with 2 s integration. The contour levels are 0.25, 0.4, 0.55, 0.7, and 0.85 of the maximum count rates of the image. Axis labels indicate the E-W and N-S coordinates in arcsec.
Current usage metrics show cumulative count of Article Views (full-text article views including HTML views, PDF and ePub downloads, according to the available data) and Abstracts Views on Vision4Press platform.
Data correspond to usage on the plateform after 2015. The current usage metrics is available 48-96 hours after online publication and is updated daily on week days.
Initial download of the metrics may take a while.