Fig. 6
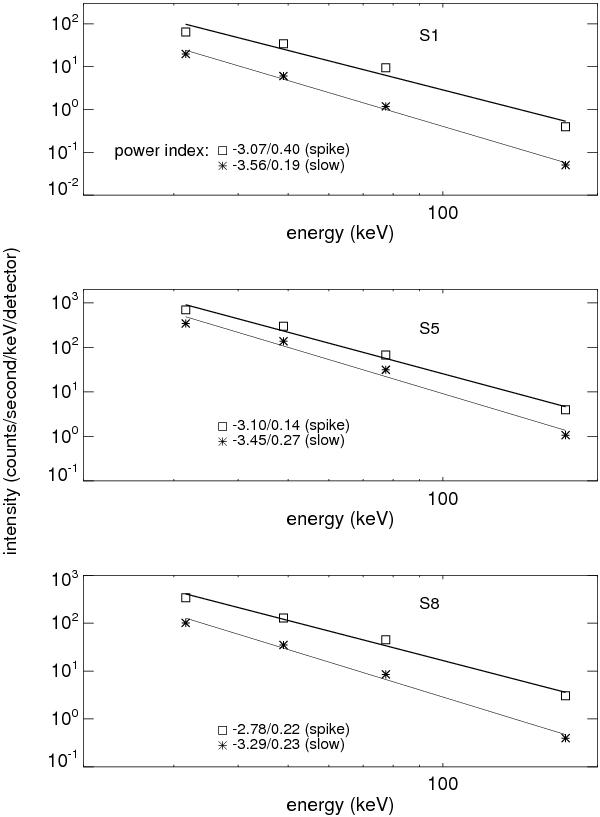
In each panel, the symbols and solid lines show examples of hard X-ray photon count spectra of integrated spike flux from the Gaussian fitting, in comparison with the count rates spectra of underlying components. Solid lines show the least-squares fit of the spectra to a power-law distribution, and the exponents and their uncertainties from the fit are noted in the figures. The y-axis gives the units of the spike intensities, and the intensities of the underlying component are divided by four for clarity. The three panels from top to bottom illustrate the count spectra for spikes S1, S5, and S8, respectively, and the underlying components.
Current usage metrics show cumulative count of Article Views (full-text article views including HTML views, PDF and ePub downloads, according to the available data) and Abstracts Views on Vision4Press platform.
Data correspond to usage on the plateform after 2015. The current usage metrics is available 48-96 hours after online publication and is updated daily on week days.
Initial download of the metrics may take a while.