Fig. 3
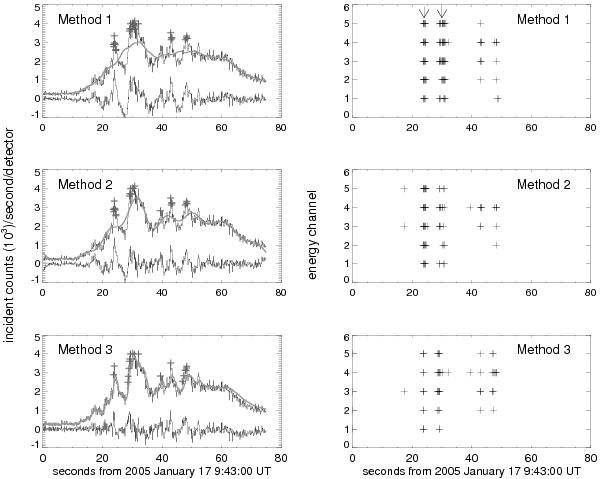
Example of spike detection algorithm using 3 methods (see text) for the 2005 January 19 event. Left panels show the demodulated light curves (dark) at 60–100 keV, the slow-varying component (gray) determined by 3 methods, and the residuals (bottom of each panel), with the significant residuals marked (plus symbols). Right panels show the times (x-axis) and energies (y-axis) of significant residuals recognized by the algorithms. The numbers 1 to 7 along the y-axis indicate energy bands of 10–15, 15–25, 25–40, 40–60, 60–100, 100–300, 25–100 keV, respectively. The two arrows in the top right panel indicate the most pronounced spikes standing out in the diagrams.
Current usage metrics show cumulative count of Article Views (full-text article views including HTML views, PDF and ePub downloads, according to the available data) and Abstracts Views on Vision4Press platform.
Data correspond to usage on the plateform after 2015. The current usage metrics is available 48-96 hours after online publication and is updated daily on week days.
Initial download of the metrics may take a while.