Fig. 11
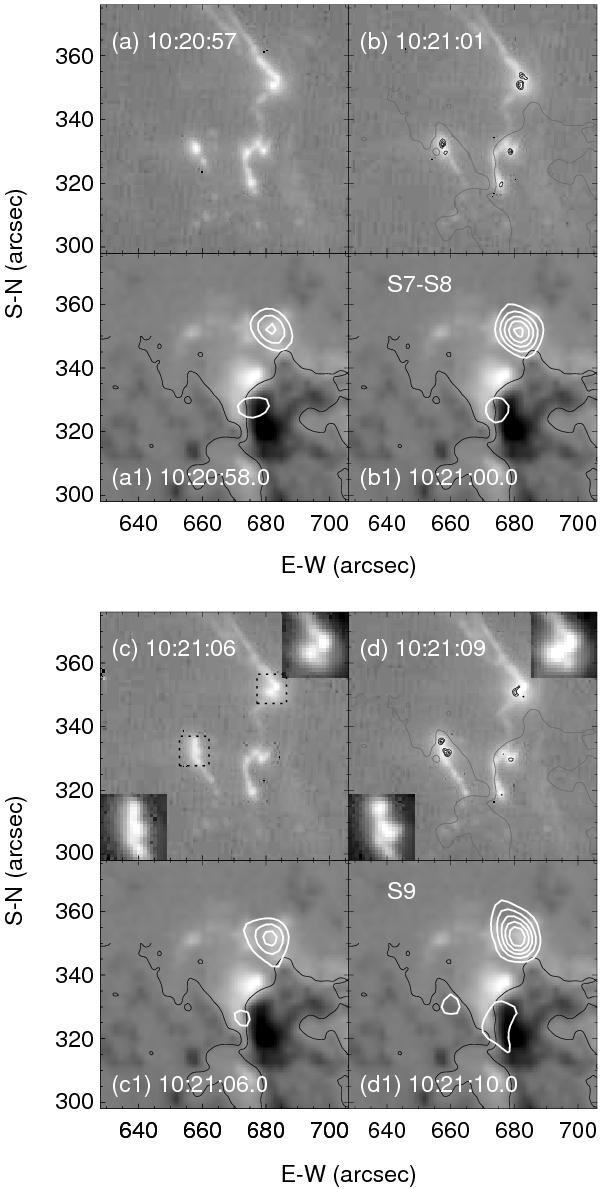
Bottom panel: RHESSI hard X-ray maps (white contours) at 25–100 keV around the times of spikes b) S7-S8 and d) S9, and pre-spike times (a) and c)) on 2005 January 19, superposed on the longitudinal magnetogram taken at 09:36:02.32 UT by MDI. The integration time of each image is 2 s. The contour levels are 0.25, 0.4, 0.55, 0.7, and 0.85 of the maximum count rates of the images, which is 2.52 photons cm-2 s-1 asec-2. Top panel: snapshots of TRACE 1600 Å images around the times of RHESSI maps. The inset gray-scale images in c) and d) are magnified images of two kernels, the FOV being indicated by the white boxes in c). The over plotted dark contours in b) and d) show the difference between the spike image and pre-spike background image by TRACE, the contour level being 0.3, 0.5, 0.7 of the maximum of each difference image. Gray contours indicate the polarity inversion line of longitudinal magnetic fields.
Current usage metrics show cumulative count of Article Views (full-text article views including HTML views, PDF and ePub downloads, according to the available data) and Abstracts Views on Vision4Press platform.
Data correspond to usage on the plateform after 2015. The current usage metrics is available 48-96 hours after online publication and is updated daily on week days.
Initial download of the metrics may take a while.