Fig. 10
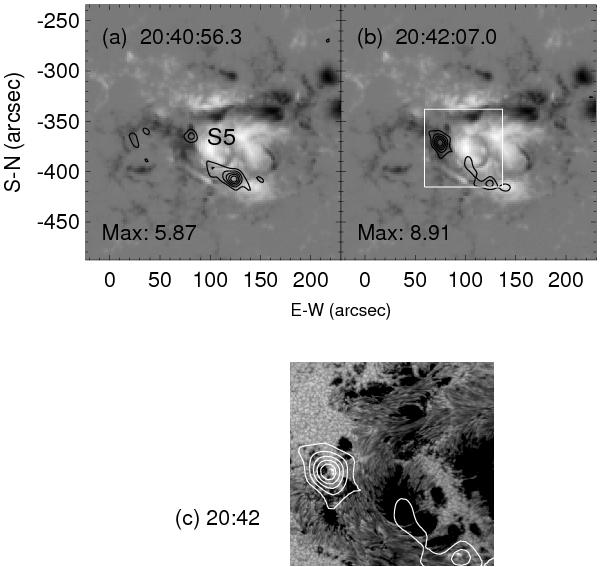
RHESSI hard X-ray clean maps (dark contours) at 25–100 keV a) of spike S5 and b) at the maximum of the 2003 October 29 flare superposed on the longitudinal magnetogram taken by MDI. Each map is constructed with 2 s integration. The contour levels are 0.25, 0.4, 0.55, 0.7, and 0.85 of the maximum count rates of each image, which is noted in each plot in the unit of photons cm-2 s-1 asec-2. c) A snapshot of an infrared image around the flare maximum revealing two bright kernels coincident with RHESSI hard X-ray sources (white contours). The white box in b) defines the FOV of c).
Current usage metrics show cumulative count of Article Views (full-text article views including HTML views, PDF and ePub downloads, according to the available data) and Abstracts Views on Vision4Press platform.
Data correspond to usage on the plateform after 2015. The current usage metrics is available 48-96 hours after online publication and is updated daily on week days.
Initial download of the metrics may take a while.