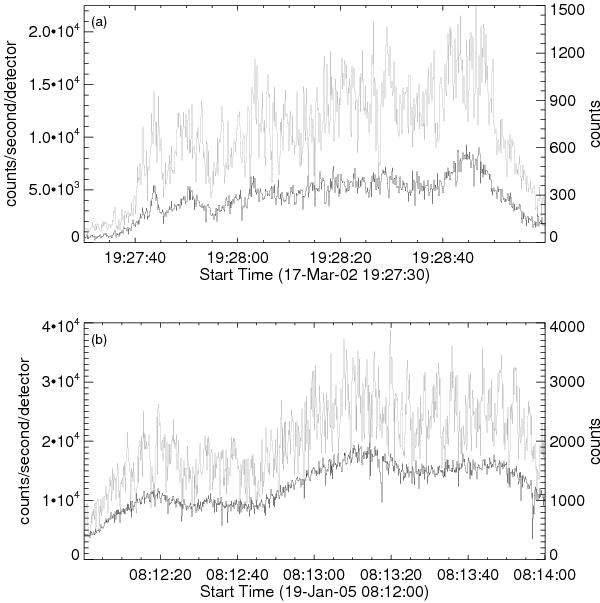
Fig. 1

Demodulated RHESSI hard X-ray light curves (dark) in comparison with summed raw data counts (gray). The light curves are acquired at 25–100 keV. Top panel shows 2002 March 17 event that exhibits fast-varying spikes and bottom panel shows 2005 January 19 event without significant fast-varying spikes. The scales of the demodulated (in units of counts per second per detector) and raw (in units of counts) light curves are indicated on the left and right y-axes, respectively.
Current usage metrics show cumulative count of Article Views (full-text article views including HTML views, PDF and ePub downloads, according to the available data) and Abstracts Views on Vision4Press platform.
Data correspond to usage on the plateform after 2015. The current usage metrics is available 48-96 hours after online publication and is updated daily on week days.
Initial download of the metrics may take a while.


