Fig. 4
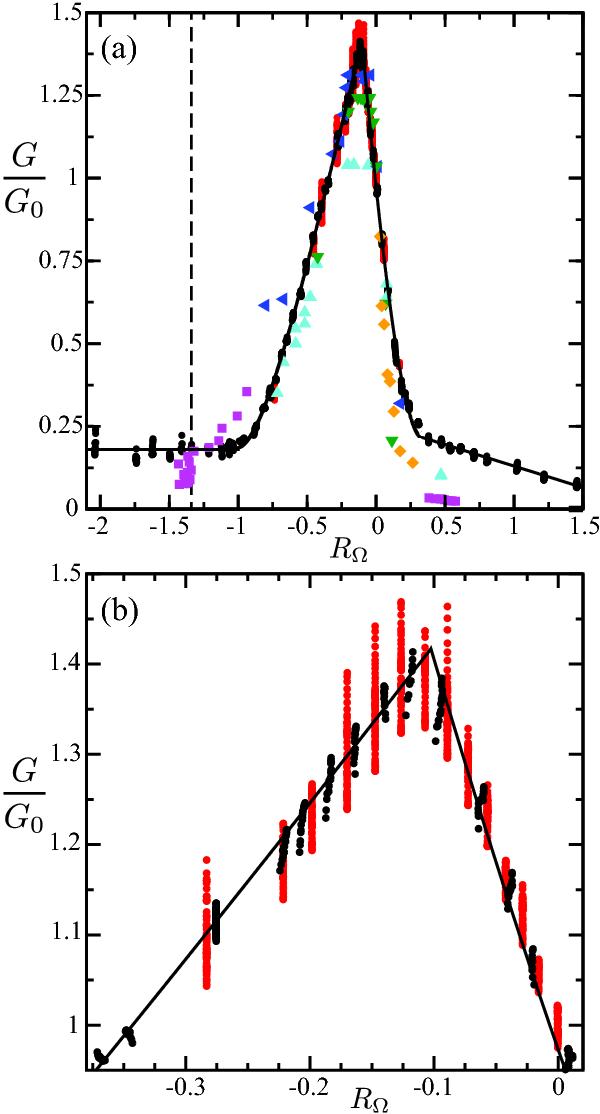
a) The dimensionless torque G normalized by G0 ≡ G(Re,RΩ = 0) for different values of the radius ratio η nicely collapses when plotted as function of RΩ. The data from Wendt (1933) are shown as cyan (η = 0.68), blue (η = 0.85) and green (η = 0.935) triangles. Additional radius ratios are examined using the data from Taylor (1936), shown as orange diamonds, Richard (Richard 2001; Dubrulle et al. 2005), given by magenta squares, Paoletti & Lathrop (2011) indicated by black circles and van Gils et al. (2011b) by red circles. The solid lines are fits given by Eq. (12). Keplerian flow states are indicated by the dashed line at RΩ = −4/3. In b) we focus on the peak of the curve shown in a), but only present the data from Twente (van Gils et al. 2011b) (red) and Maryland (Paoletti & Lathrop 2011) (black). The solid line is the fit (12).
Current usage metrics show cumulative count of Article Views (full-text article views including HTML views, PDF and ePub downloads, according to the available data) and Abstracts Views on Vision4Press platform.
Data correspond to usage on the plateform after 2015. The current usage metrics is available 48-96 hours after online publication and is updated daily on week days.
Initial download of the metrics may take a while.