Fig. 2
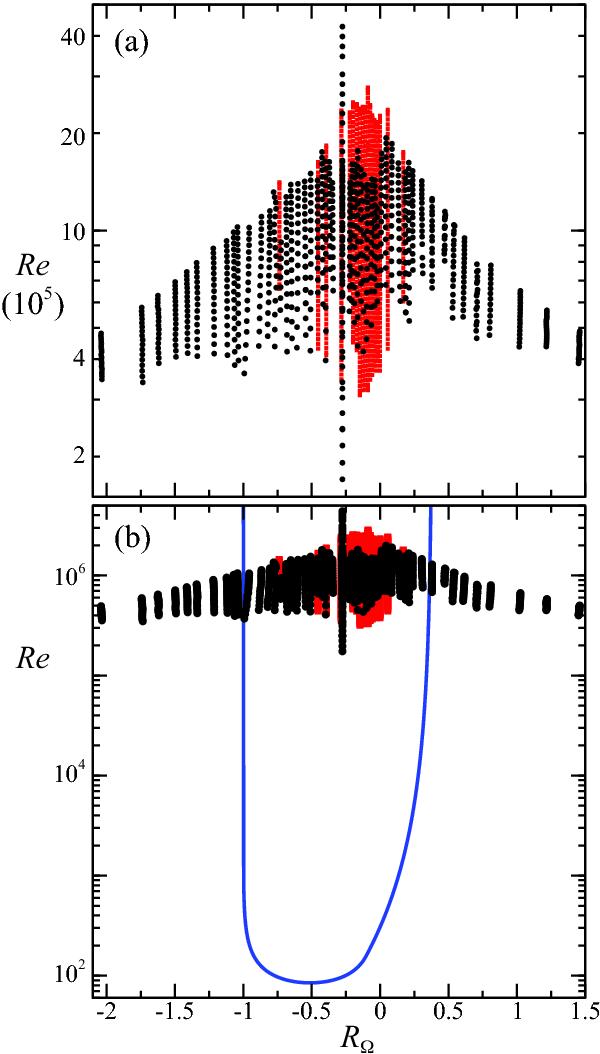
a) Our experiments span a large range of the Reynolds number Re, which controls the turbulence intensity, and the rotation number RΩ, introduced by Dubrulle et al. (2005), which compares shear to overall rotation. The rotation number can be used to distinguish between Rayleigh-stable flows (RΩ ≤ −1 or RΩ ≥ (1 − η)/η) and those that are linearly unstable (−1 < RΩ < (1 − η)/η). b) All of our measurements for −1 < RΩ < 0.38 are well above the linear stability curve (blue line) described by Esser & Grossmann (1996) and given by Eq. (8). The data are taken from separate experiments by van Gils et al. (2011b) (red squares) and (Paoletti & Lathrop 2011) (black circles).
Current usage metrics show cumulative count of Article Views (full-text article views including HTML views, PDF and ePub downloads, according to the available data) and Abstracts Views on Vision4Press platform.
Data correspond to usage on the plateform after 2015. The current usage metrics is available 48-96 hours after online publication and is updated daily on week days.
Initial download of the metrics may take a while.