Fig. 5
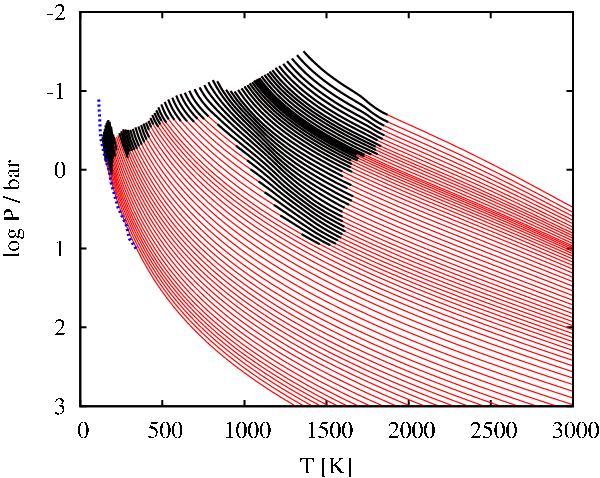
Evolutionary sequence of the pressure-temperature profiles near the surface of the planet. The first profile (on the right) corresponds to t = 1 Myr, while the last one (on the left) is at t = 4.6 Gyr. The thick black lines show radiative zones. The blue dotted line is the profile measured by the Galileo space probe (from Lodders & Fegley 1998).
Current usage metrics show cumulative count of Article Views (full-text article views including HTML views, PDF and ePub downloads, according to the available data) and Abstracts Views on Vision4Press platform.
Data correspond to usage on the plateform after 2015. The current usage metrics is available 48-96 hours after online publication and is updated daily on week days.
Initial download of the metrics may take a while.