Fig. 3
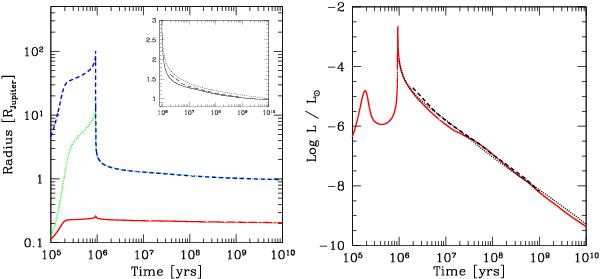
Left panel: radius R (blue dashed line), core radius Rcore (red solid line), and capture radius Rcapt (green dotted line) as a function of time. The inset figure is a zoom-in onto the late evolution and shows the radius as found in this work (solid line), in Baraffe et al. (2003) (dashed), and in Burrows et al. (1997) (dotted). Right panel: total luminosity L as a function of time (red solid line). The dashed line shows Baraffe et al. (2003), and the dotted one is Burrows et al. (1997).
Current usage metrics show cumulative count of Article Views (full-text article views including HTML views, PDF and ePub downloads, according to the available data) and Abstracts Views on Vision4Press platform.
Data correspond to usage on the plateform after 2015. The current usage metrics is available 48-96 hours after online publication and is updated daily on week days.
Initial download of the metrics may take a while.