Fig. 2
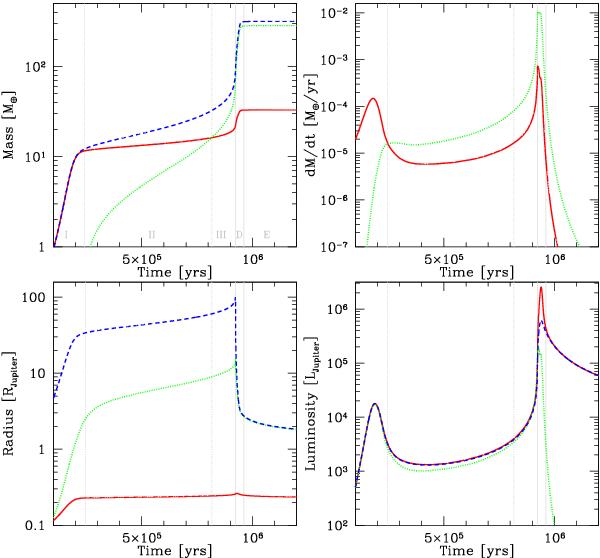
Simulation of the in situ formation of Jupiter at 5.2 AU. Gray vertical lines show the major phases, labeled in the top left panel: I, II, III during the attached phase, D for the detached phase, and E for the evolutionary phase. The top left panel shows the evolution of the core mass (red solid line), the envelope mass (green dotted line), and the total mass (blue dashed line). The top right panel shows the accretion rate of solids ṀZ (red solid line) and gas ṀXY (green dotted line). The limiting gas accretion rate is fixed to 10-2 M⊕/yr. The bottom left panel shows the evolution of the core radius Rcore (red solid line), the total radius R (blue dashed line), and the capture radius for planetesimals Rcapt (green dotted line). The bottom right panel shows the luminosity of the planet in present day intrinsic luminosities of Jupiter (LX = 8.7 × 10⁻¹⁰ L⊙). The red solid line is the total luminosity L, the blue dashed line is the internal luminosity Lint, and the green dotted line is the core luminosity Lcore.

Current usage metrics show cumulative count of Article Views (full-text article views including HTML views, PDF and ePub downloads, according to the available data) and Abstracts Views on Vision4Press platform.
Data correspond to usage on the plateform after 2015. The current usage metrics is available 48-96 hours after online publication and is updated daily on week days.
Initial download of the metrics may take a while.