Fig. 1
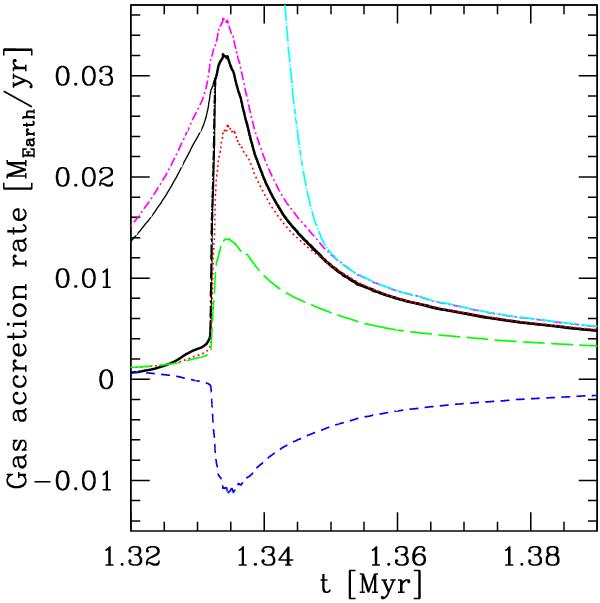
Gas accretion rates as a function of time of a forming giant planet, and accretion rate in the surrounding protoplanetary disk at the moment of transition into gas runaway accretion. The thick black solid line is the accretion rate of the planet ṀXY. The thin solid black line is the disk-limited rate ṀXY,max. The red dotted line is ṀXY,max,F, the (non-equilibrium) flow-limited maximal accretion rate, while the rate limited by the local reservoir is shown by the magenta dashed-dotted line (ṀXY,max,R). The cyan long-dashed-dotted line shows Mfeed/dt. The accretion rate in the disk inside the planet’s position, ṀI, is the blue dashed line, while the accretion rate in the disk outside the planet’s position ṀO is the green long-dashed line.
Current usage metrics show cumulative count of Article Views (full-text article views including HTML views, PDF and ePub downloads, according to the available data) and Abstracts Views on Vision4Press platform.
Data correspond to usage on the plateform after 2015. The current usage metrics is available 48-96 hours after online publication and is updated daily on week days.
Initial download of the metrics may take a while.