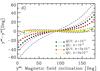
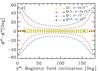
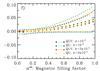
Fig. 5
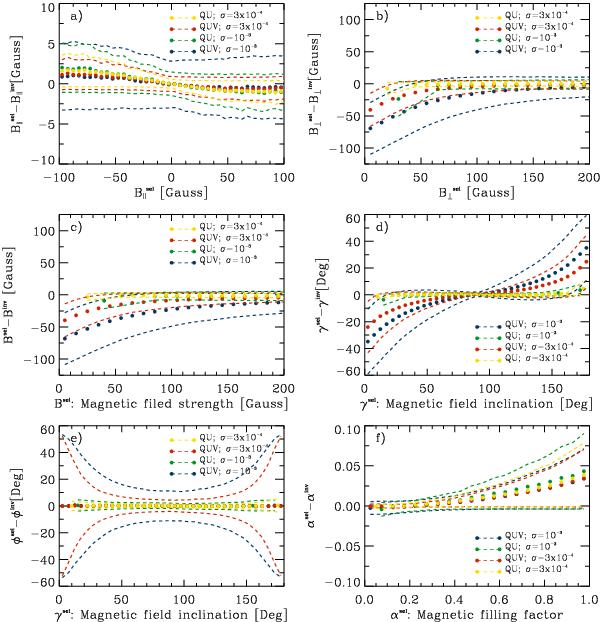
Mean values of the differences between the original physical parameters and the inferred values (ΔXi; circles) and standard deviations around the mean (dashed lines; σx): (panel-a)) ΔB∥ and σB∥ as a function of B∥; (panel-b)) ΔB⊥ and σB⊥ as a function of B⊥; (panel-c)) ΔB and σB and a function of B; (panel-d)) Δγ and σγ as a function of γ; (panel-e)) Δφ and σφ as a function of γ; and finally, (panel-f)) Δα and σα as a function of α. Blue shows the results obtained from a photon-noise level of σ = 10-3 and selection criterion S/Rquv (from Fig. 1); red represents σ = 3 × 10⁻⁴ and S/Rquv (from Fig. 2); green is for σ = 10-3 and S/Rqu (from Fig. 3); and yellow is for σ = 3 × 10⁻⁴ and S/Rqu (from Fig. 4).
Current usage metrics show cumulative count of Article Views (full-text article views including HTML views, PDF and ePub downloads, according to the available data) and Abstracts Views on Vision4Press platform.
Data correspond to usage on the plateform after 2015. The current usage metrics is available 48-96 hours after online publication and is updated daily on week days.
Initial download of the metrics may take a while.