Free Access
Fig. 16
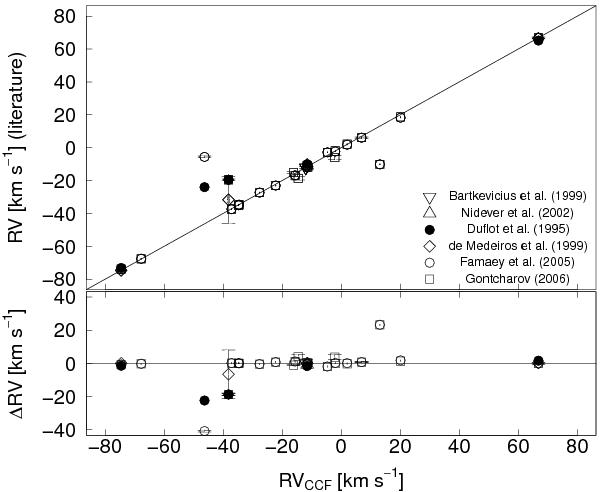
Radial velocities derived from our cross-correlation analysis compared with those available in the literature. Relation (top) and differences (bottom) between the RV results are shown. The uncertainties of the RVs are presented if available. The solid line presents the one-to-one relation.
Current usage metrics show cumulative count of Article Views (full-text article views including HTML views, PDF and ePub downloads, according to the available data) and Abstracts Views on Vision4Press platform.
Data correspond to usage on the plateform after 2015. The current usage metrics is available 48-96 hours after online publication and is updated daily on week days.
Initial download of the metrics may take a while.