Fig. 14
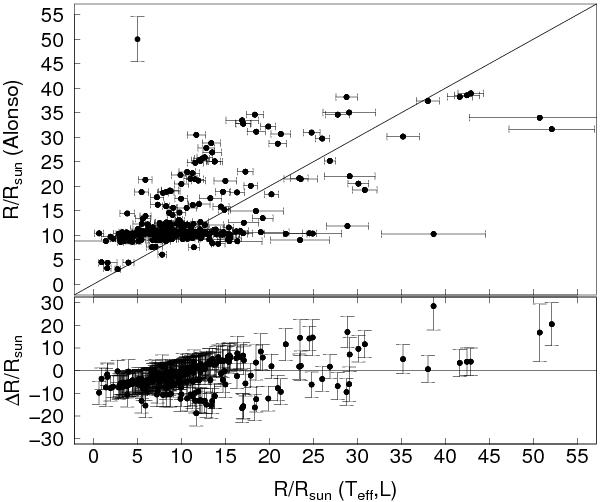
Comparison of the R/R⊙ for the 332 PTPS stars derived here and calculated from the empirical calibration of Alonso et al. (2000). Both relation (top) and differences (bottom) are presented. The uncertainties in our determinations are shown for every target, whereas for Alonso et al. (2000) radii a typical uncertainty for 10 R⊙ star is denoted in the upper left corner. The solid line presents the one-to-one relation.
Current usage metrics show cumulative count of Article Views (full-text article views including HTML views, PDF and ePub downloads, according to the available data) and Abstracts Views on Vision4Press platform.
Data correspond to usage on the plateform after 2015. The current usage metrics is available 48-96 hours after online publication and is updated daily on week days.
Initial download of the metrics may take a while.