Fig. 9
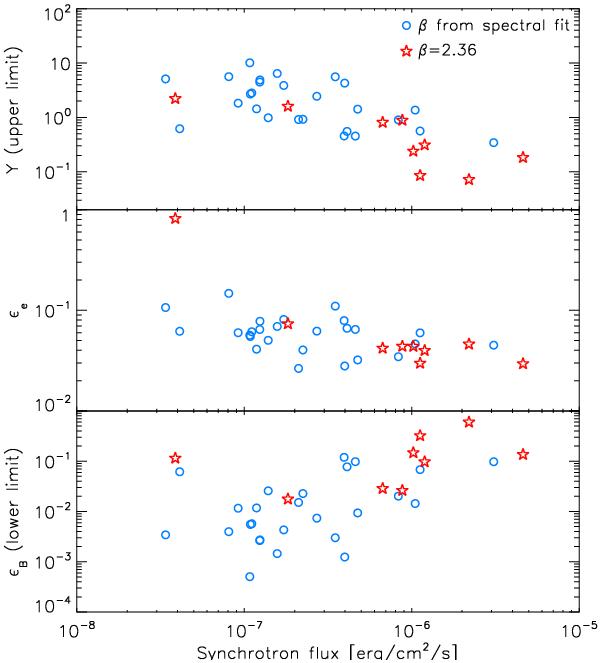
Upper limit for the Compton parameter Y, the estimate of ϵe, and the lower limits for ϵB as a function of the prompt flux for the sample of GRBs with measured Epeak. When β cannot be constrained from the spectral analysis, a value of β = 2.36 is assumed (red stars). In the other cases the value derived from the spectral fit is adopted (blue circles).
Current usage metrics show cumulative count of Article Views (full-text article views including HTML views, PDF and ePub downloads, according to the available data) and Abstracts Views on Vision4Press platform.
Data correspond to usage on the plateform after 2015. The current usage metrics is available 48-96 hours after online publication and is updated daily on week days.
Initial download of the metrics may take a while.