Fig. 3
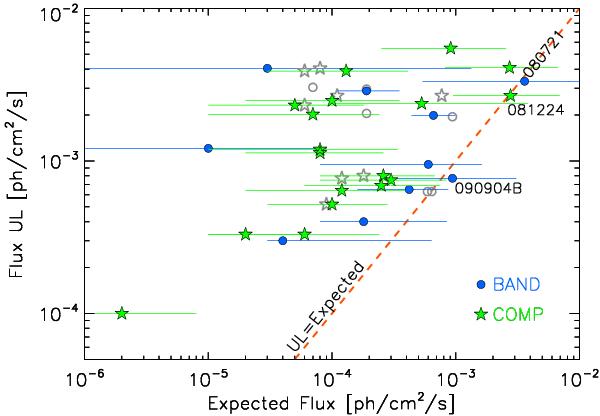
Comparison between the flux expected in the 30 MeV−3 GeV energy range (from the extrapolation of the keV−MeV spectral component) and the flux upper limit estimated in the same energy range. The sample is composed of the 28 GRBs for which it has been possible to estimate the peak energy of the prompt component from the spectral analysis. Preliminary spectral results from the GCN are considered: in 10 cases the spectrum is well fit by a BAND model (filled circles), while in 18 cases the best-fit model is a power law with an exponential cutoff (filled stars). Open gray symbols show the same comparison when spectral parameters are taken from Nava et al. (2011) and Bissaldi et al. (2011).
Current usage metrics show cumulative count of Article Views (full-text article views including HTML views, PDF and ePub downloads, according to the available data) and Abstracts Views on Vision4Press platform.
Data correspond to usage on the plateform after 2015. The current usage metrics is available 48-96 hours after online publication and is updated daily on week days.
Initial download of the metrics may take a while.