Fig. 4
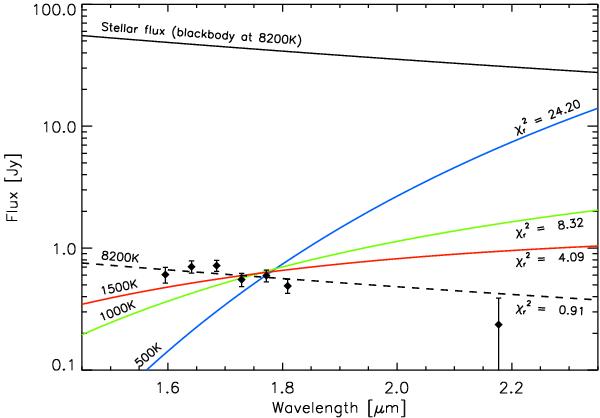
Best-fit resolved fluxes given as a function of wavelength, assuming that β Pic emits as a blackbody of temperature 8200 K. The solid lines give the flux expected from blackbody sources of various equilibrium temperatures and the optimum emitting surface area (computed by χ2 minimisation). The dashed line represents the flux from a blackbody source of 8200 K or, equivalently, from scattered stellar light ( ). The K-band flux obtained from archival VLTI/VINCI measurements is shown for comparison but is not included in the fit (see more information in the main text).
Current usage metrics show cumulative count of Article Views (full-text article views including HTML views, PDF and ePub downloads, according to the available data) and Abstracts Views on Vision4Press platform.
Data correspond to usage on the plateform after 2015. The current usage metrics is available 48-96 hours after online publication and is updated daily on week days.
Initial download of the metrics may take a while.