Fig. 1
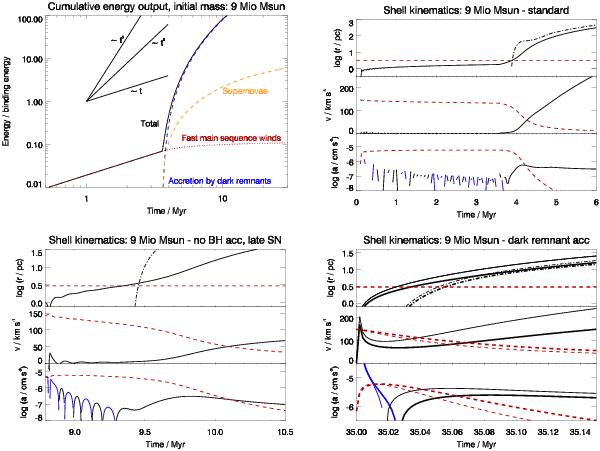
Produced energyfor the standard scenario (top left) and superbubble kinematics for different assumptions about the energy contributors; top right (standard): winds and SNe for all massive stars and energy output from all black holes and neutron stars; bottom left (no BH acc, late SN): only SNe of starsless massive than 25 M⊙ that explode after8.79 Myr; bottom right (dark remnant acc): only sudden accretion onto the dark remnants(thick lines: black holes, only; thin lines: also neutron stars). The timescale for the global evolution of the GC is chosen at the birth of a coeval first generation of stars. The abscissae indicate the respective starting times of the three considered ejection scenarios, which corresponds to the moment when the considered energy sources become available. In scenario 3 this could happen any time once all the dark remnants have formed, i.e., after the last SN at 35 Myr after the birth of the 1G stars. Within each kinematics plot, the upper diagram shows the bubble radius (solid line) and the Rayleigh-Taylor scale (dash-dotted line), with the red dashed line indicating the half-mass radius. The middle diagram displays the shell velocity (solid line) and the escape velocity at the current bubble radius (red dashed line). The acceleration (positive: solid black line, negative: solid blue line) is shown in the lower diagram, with the gravitational acceleration at the current radius shown as a red dashed line.
Current usage metrics show cumulative count of Article Views (full-text article views including HTML views, PDF and ePub downloads, according to the available data) and Abstracts Views on Vision4Press platform.
Data correspond to usage on the plateform after 2015. The current usage metrics is available 48-96 hours after online publication and is updated daily on week days.
Initial download of the metrics may take a while.