Fig. 4
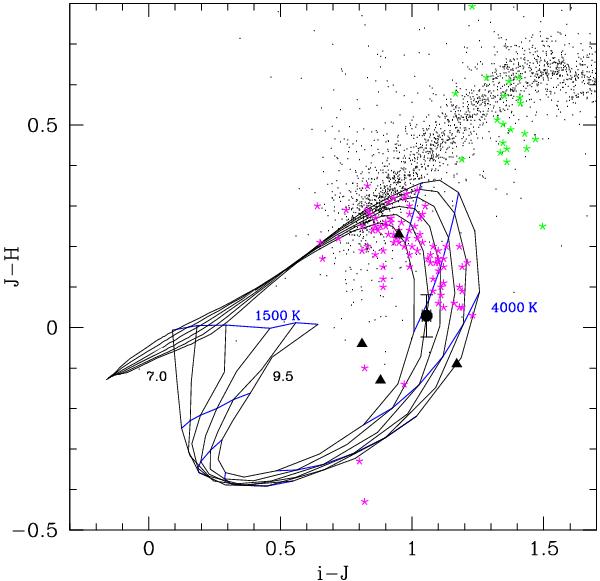
J − H vs. i − J colour–colour diagram. The solid circle corresponds to LSR J0745+2627, and solid triangles to cool white dwarfs from Kilic et al. (2010b) and Kilic et al. (2012). Black lines correspond to values with equal log g and blue lines with equal Teff for pure-H composition (Sect. 3). Black points and asterisks represent the same as in Fig. 2.
Current usage metrics show cumulative count of Article Views (full-text article views including HTML views, PDF and ePub downloads, according to the available data) and Abstracts Views on Vision4Press platform.
Data correspond to usage on the plateform after 2015. The current usage metrics is available 48-96 hours after online publication and is updated daily on week days.
Initial download of the metrics may take a while.