Fig. 7
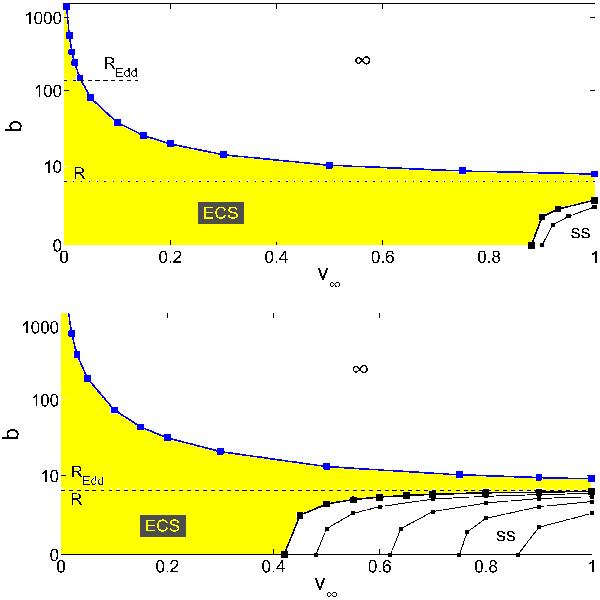
Regions in the parameter space corresponding to escaping particles (region denoted by “∞” above the blue curve), particles ending up on the Eddington capture sphere (the shaded region between the thick black curve and the blue curve, denoted by “ECS”), and particles impacting the stellar surface (region below the thick black curve, denoted by “ss”), for two values of luminosity, k = 1.49 (top), and k = 1.25 (bottom). The radius of the star is X = 6 for all plots in this section. The impact parameter, b, is in units of RG, and v∞ in units of c. Particles with initial parameters on the thick black curve settle on the surface of the star with zero velocity. The thin black curves correspond to particles impacting with (from left to right): vr(R) = 0.05,0.10,0.15,0.20.
Current usage metrics show cumulative count of Article Views (full-text article views including HTML views, PDF and ePub downloads, according to the available data) and Abstracts Views on Vision4Press platform.
Data correspond to usage on the plateform after 2015. The current usage metrics is available 48-96 hours after online publication and is updated daily on week days.
Initial download of the metrics may take a while.