Fig. 1
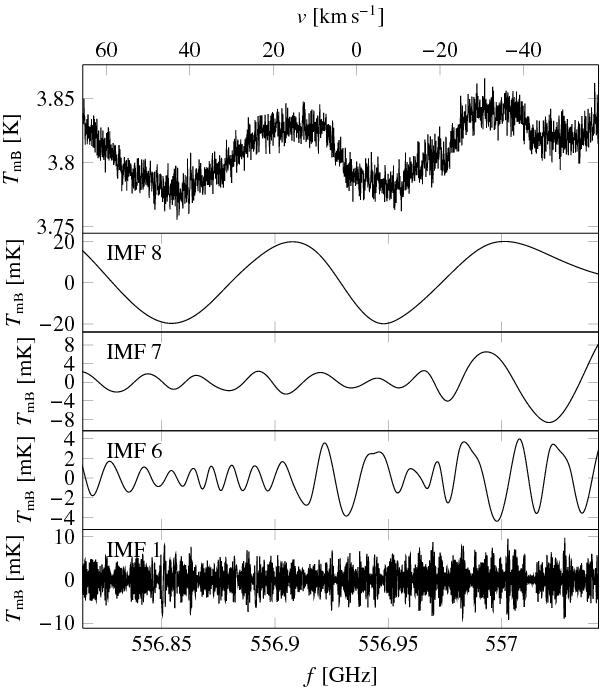
Original HRS subband 1 spectrum of the H2O 110–101 line at 556.936 GHz observed on UT 8.78 August (upper panel), and several low and high frequency components of the spectrum determined using the EMD analysis (four lower panels) with labels indicating the mode number. The vertical axis is the calibrated main beam brightness temperature. The lower horizontal axis is the upper sideband frequency, while the upper axis shows the velocity with respect to the nucleus’s rest frame.
Current usage metrics show cumulative count of Article Views (full-text article views including HTML views, PDF and ePub downloads, according to the available data) and Abstracts Views on Vision4Press platform.
Data correspond to usage on the plateform after 2015. The current usage metrics is available 48-96 hours after online publication and is updated daily on week days.
Initial download of the metrics may take a while.