| Issue |
A&A
Volume 546, October 2012
|
|
|---|---|---|
| Article Number | L2 | |
| Number of page(s) | 4 | |
| Section | Letters | |
| DOI | https://doi.org/10.1051/0004-6361/201220145 | |
| Published online | 01 October 2012 | |
A nova origin of the gas cloud at the Galactic center?
Max-Planck-Institut für Astrophysik,
Karl- Schwarzschild-Str. 1,
85740
Garching,
Germany
e-mail: emm@mpa-garching.mpg.de
Received: 31 July 2012
Accepted: 14 August 2012
The recent discovery by Gillessen and collaborators of a cloud of gas falling towards the Galactic center on a highly eccentric orbit, diving nearly straight into the immediate neighborhood of the central supermassive black hole, raises the important question of its origin. Several models have already been proposed. Here we suggest that a recent nova outburst has ejected a ring-like shell of gas. Viewed at high inclination, that could account for the mass, head and tail structure, and the unusually high eccentricity of the observed cloud in a natural way, even as the nova moves on a quite normal orbit for the young stars in the close neighborhood of the Galactic center. We illustrate this by calculating orbits for the head and tail parts of the ejecta and the nova that has produced it. We briefly discuss some of the questions that this model, if true, raises about the stellar environment close to the Galactic center.
Key words: Galaxy: center / ISM: clouds / novae, cataclysmic variables
© ESO, 2012
1. Introduction
The discovery by Gillessen et al. (2012) of a cloud of gas freely falling toward the Galactic center on an orbit diving deeply into the immediate neighborhood of the central supermassive black hole, is a great achievement that raises important questions for our understanding of the Galactic center. The cloud was recognized as a moving object in L′-band observations. In the position-velocity maps of Brγ emission, obtained with SINFONI, a bright “head” of emission appears with a “tail” of lower surface brightness (Gillessen et al. 2012, Fig. 2). How did this cloud form and how did it get the peculiar orbit so close to the central supermassive black hole that it already now shows the destructive shear of gravity? The surprising answer might be that we are witnessing the recent outburst of a nova, the ejecta now freely falling toward the Galactic center and being observed as they disperse in the close neighborhood of the black hole.
2. Proposed models
The origin of this cloud is an intriguing question, and several proposals have been made immediately. Gillessen et al. (2012) present two suggestions. The cloud could originate in (1) colliding winds in the so-called “clock-wise” disk of young, massive stars, which might create low angular momentum gas and which then falls into the potential well of the black hole; or (2) in a compact planetary nebulae. The work of Burkert et al. (2012), which includes the physical processes in the cloud/atmosphere system, focuses on detailed numerical simulations to follow the cloud on its way towards its pericenter and beyond. Additional hydrodynamical simulations were carried out by Schartmann et al. (2012) to compare the validity of the two suggested models, the compact cloud and the spherical shell scenarios. The latter model is favored since their test particle computations of an initial ring structure at the apocenter (in their two-dimensional simulation) allow parameters to be chosen such that the hydrodynamical evolution for the following years, showing the severe stretching of the ring by the gravitational force of the black hole, matches the observed structure of the cloud in the position-velocity diagram.
An alternative third picture has been proposed by Murray-Clay & Loeb (2012): a dense, proto-planetary disk around a star, scattered from the observed ring of young stars, which loses mass through photo-evaporation as it approaches the supermassive black hole. Taking up the photo-evaporation suggestion, Miralda-Escudé (2012) presents a similar model, proposing that this process happens in an old, low-mass star, deflected into its high-eccentricity orbit after a close encounter with a stellar mass black hole. The small debris disk around the star could create a cloud like the one observed at every orbit around the Galactic center. The latter paper includes a detailed discussion of the problems faced by the various proposed models.
3. Mass of the cloud, velocity, and the warm dust
There are three features that may point to another origin, a nova outburst: a mass of the cloud of 10-5 solar masses, dust, and velocities on the order of 1000 km s-1.
Nova outbursts are a much studied phenomenon of cataclysmic variables. These close binaries contain a white dwarf primary and usually a low-mass Roche-lobe-filling secondary star, from which mass flows over to the primary star via an accretion disk. If enough matter has accumulated on the surface of the white dwarf, a thermonuclear run-away explosion in the partially degenerate gas, the nova outburst, occurs. These outbursts occur again and again over the lifetime of the binary system.
Observed nova shells have masses between 10-5 and 10-4 solar masses (Shore 2008) and ejecta velocities of a few hundred up to more than a thousand km s-1 (Downes & Duerbeck 2000). The observed cloud mass of about 10-5 solar masses is at the lower limit of shell masses and thus might be only a fraction of the total ejected mass. The three-dimensional velocity of the cloud was 1200 km s-1 observed in 2004 and increased to 2350 km s-1 in 2011 as it moved closer to the central black hole (Gillessen et al. 2012). The observed velocities would result from the addition of orbital and ejecta velocity of the nova. That these are found to be of the same order of magnitude is an interesting fact as we see later.
Nova shells contain dust in very different amounts. The dust formation theory is complex, since for molecules to form and grains to aggregate, temperatures below 1000 K are required. The process depends on the metal abundances, and these vary between the lower mass CO white dwarfs and the more massive ONe white dwarfs. Gillessen et al. (2012) estimate the temperature and the amount of warm dust in the cloud from the L′-band (3.76 μm) luminosity as the reradiation by dust grains, irradiated by the massive stars in the surroundings, as 550 ± 90 K and 2 × 10²³ g. The latter is on the lower side of the observed range in nova shells. We note that destruction of dust in the evolution of nova shells has been discussed in Evans et al. (2005).
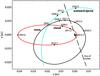 |
Fig. 1 Three orbits around the supermassive black hole at the Galactic Center. Red line: orbit of the cloud as determined in Gillessen et al. (2012) (taken from Schartmann et al. 2012, G2 in their Fig. 1), in our model interpreted as the inward ejecta of highest surface brightness for the observer. Black: the orbit of the nova that produced it. Blue: the orbit of the outward ejecta, which in projection are the highest surface brightness feature of the opposite ring region, identified with the tail. The years 2013.5, 2020.5, and 2012.1 denote the pericenters of the ellipses with quite different orientation and eccentricity, the cross denotes the position of the black hole. Dashed line: line of nodes, the intersection of the common plane of all orbits and the plane of sky, inclined to each other by a nearly right angle of i = 109.6°. See text. |
4. Geometry of the expanding nova shell
Observations of resolved nova shells document a variety of shapes of ejected gas around the white dwarf (O’Brian & Bode 2008). Slavin et al. (1995) analyzed shells of 13 classical novae and found indications of a correlation between the speed class of a novae (which measures the rate of luminosity increase in outburst) and the shape of the shell, in the way that faster novae tend to comprise randomly distributed clumps of ejecta superposed on spherically symmetric diffuse material, while slower novae produce more structured ellipsoidal remnants with rings of enhanced emission. Downes & Duerbeck (2000) studied images of resolved shells of recent novae, and find the densest gas clouds often concentrated in a ring. Krautter et al. (2002) obtained near-infrared images of classical novae, find further support for a correlation between speed class and shape of the shell, and also point out a more or less pronounced density inhomogeneity.
As an example, we consider here a ring-like shape of the ejecta. The question arises how the orbital plane of the binary system (the preferred direction of the ejected ring) is oriented with respect to the observer. Depending on the inclination, our line of sight passes through a higher column density at the “edge” of the ring (i.e. at the ends of the major axis of the ring projection). A simple slab model with thickness d (the diameter of the ring cross section) and inclination ϑ yields a length l of this column l = dtanϑ. For the stochastic mean of arbitrary orientation, ϑ = 60°, l/d is 1.7, however, it rises rapidly with higher inclination, l/d = 5.7 for ϑ = 80°. For ϑ = 90°, a ring seen edge-on, for a diameter 1/10 of the ring radius, l/d has a maximum value of 6.7. Because the surface brightness of the ring emission is proportional to the column density, the observations of Gillessen et al. (2012), which show a pronounced head-tail structure in brightness distribution, would point to a rather high inclination. We consider a ring in the orbital plane of the observed cloud, which is highly inclined to our line of sight. We note that there is no reason why the two planes should coincide, so it is a somewhat arbitrary choice made for the sake of simplicity.
In their spherical shell scenario SS0 for the origin of the cloud Burkert et al. (2012) and Schartmann et al. (2012) also considered a gas shell starting at the apocenter of the observed highly eccentric orbit of the cloud. In their two-dimensional simulation they followed the evolution of an initial ring of test particles in the orbital plane. The distortion of this ring into an elongated structure can be seen in their Figs. 12 and 5, respectively. The initial conditions, an expansion velocity of 125 km s-1, radius, and thickness of the ring, were chosen to best reproduce the observations of the cloud.
5. Three elliptical orbits around the black hole
In Fig. 1 we show three orbits. One is the orbit of the cloud as derived by Gillessen et al. (2012) from the observations. There are many ways in which this cloud orbit can be thought of as having come about as the best visible part of nova ejecta. The two other orbits are such an example, and they show the orbit of the nova system itself and a corresponding, “second-best” visible part of the ejecta, in projection to the observer.
5.1. An example
We note that there is a wide range of parameters in shell mass, ejecta velocity, shape and clumpiness of observed novae. Besides the orientation of the plane in which the binary lies, another free parameter for our modeling is the moment of the nova explosion.
The explosion should have happened before the cloud was first observed in the year 2002. A nova outburst right in 2001 seems excluded since, during the nebular phase the hydrogen burning, the white dwarf surface is exposed and irradiates the expanding dust shell, and the re-radiated infrared luminosity would significantly decrease when the distance between central star and shell grows as the shell expands, which does not seem to be observed. Thus one concludes that the hydrogen surface burning, typically continuing for two to three years after the onset of the outburst, had already ended and the outburst should have occurred at or before the year 2000. (The same date was chosen for the start of the evolution of a test particle cloud in the analysis of Gillessen et al. 2012.)
With our assumption of the ring lying in the orbital plane of the observed cloud, we have to find the orbit of the nova in this plane such that the orbit of the ejecta, best visible in projection, is that of the cloud. We take the ejecta velocity as 500 km s-1 corresponding to a slow nova. This velocity is the difference between the velocities of the cloud and the nova and, for the best visibility in projection, is directed at a right angle to the line of sight, as discussed in the previous section. The same procedure also yields the orbit of the second part of the ejecta at which we again look tangentially through the edge of the ring, directed outward with respect to the orbit around the black hole. Figure 1 shows the resulting orbits: the red line is the orbit of the inward directed ejecta, identified with the observationally determined orbit of the cloud, black is the orbit of the nova from which the ejecta originated, and blue is the orbit of the outward directed ejecta.
5.2. Orientation and eccentricity of the orbits
Table 1 lists the parameters of these three orbits. The pericenter of the ellipses are reached for the cloud in 2013.5 and the nova in 2020.5 and was already reached for the outward ejecta in 2012.1. The major axis of the binary and the outward ejecta are turned by 26.0° and −117.8°, respectively, compared to the cloud. Since the orbits of the nova and the outer ejecta lie on the same plane as the orbit of the cloud, their inclination i and their position angle of ascending node Ω are the same, i = 106.55° and Ω = 101.5°.
But the most interesting point is the very different eccentricity. In contrast to the extreme value of the cloud, e = 0.9384, the values 0.628 and 0.459 are quite normal for stellar orbits in the neighborhood of the Galactic center, as compiled by Gillessen et al. (2009). Our example shows that if the cloud originates in a nova outburst, its high eccentricity can result in a natural way. Generally, ejecta in the direction towards the inside of an orbit will move on orbits with higher eccentricity, and ejecta in direction outwards with lower eccentricity.
Keplerian orbits around the black hole.
6. Brγ radiation
In the observations of Gillessen et al. (2012), the very prominent cloud head is visible in both the infrared L′-band continuum and the Brγ line, and the lower surface brightness feature, the tail, is still clearly visible in Brγ radiation. Its integrated Brγ flux is comparable to that of the cloud. Weak Brγ light distributed between the two can be seen. We have not calculated the orbits of other ejecta in our ring-like shell model, but do tentatively identify this with light from the other ring regions between the two end points. One would expect a certain broadness in the line of sight velocity distribution and, if one wishes, one might see such a feature in the position-velocity maps (Fig. 2 of Gillessen et al. 2012), in particular that of 2011. In addition there appears to be some indication of clumpiness.
While the head between 2008 and 2011 had moved significantly closer to the Galactic center and becomes distorted along its orbit by the tidal forces, the tail feature in projection has not changed very much in position and velocity. We compare this development of the cloud structure with the orbits shown in our Fig. 1. Since we look closely along the common orbital plane, the projections occur practically parallel in the direction vertical to the line of nodes. The change in positions on the orbits projected on the plane of the sky (perpendicular to the line of sight) and the velocities projected along the line of sight on the two orbits, named cloud and outer ejecta, show such behavior.
If we suppose a common origin of both the head and tail of the cloud, what is the velocity with which those two parts moved apart from each other? A look at Fig. 1 shows that the true distance between the two in 2008 is very close to what is projected on the line of nodes, i.e. very close to the one projected on the plane of the sky. From Fig. 2 of Gillessen et al. (2012) the latter is about 0.25 arcsec, corresponding to 1016.5 cm at the distance of the Galactic center. For the eight years between the assumed time of explosion in 2000 and the observation in 2008, this yields a velocity of about 1200 km s-1 for the speed of separation, or an ejecta velocity of 600 km s-1. This is a typical value for observed nova ejecta and is indeed close to the velocity assumed in our example. A similar value results for the 2011 data, maybe slightly affected by the gravitational acceleration from the Galactic center.
In an expanding nova shell the density decreases with time, which leads to a gradual decrease in brightness in the recombination lines. This affects the outer ejecta that in our example find themselves on a wide orbit around the black hole. In contrast, the inner ejecta, the cloud head, fall on a highly elliptical orbit nearly straight towards the black hole. This part of the ejecta becomes elongated along its path by the tidal force, but becomes compressed in the two orthogonal directions so that the density even increases. The general picture of the cloud region is that of an HII region of roughly constant temperature, which is kept ionized by the radiation field of the surrounding bright stars (Gillessen et al. 2012). In this situation the recombination rate, hence the emission of Brγ line radiation, is proportional to the square of the density. This might account for the contrast in surface brightness of the Brγ radiation as a result of the different densities in head and tail. We notice that large-scale clumpiness of the ejecta might also affect the appearance of the general cloud pattern.
Finally, the question arises whether the nova itself could be seen. After the years since about 2000 the nova is probably extinct. To now observe Brγ radiation from the nova would require a remaining, significantly less massive, but denser HII region surrounding the binary system that is moving together with it.
7. Cataclysmic variables near the Galactic center?
If true, the nova model, demanding the presence of a cataclysmic variable so close to the Galactic center, raises interesting questions. Formation of a CV white dwarf needs about 108 years of evolution into the asymptotic giant branch phase of a four to five solar mass main sequence star (Ekström et al. 2012). Furthermore, a low-mass star of mass less than that of the white dwarf must be captured to form a cataclysmic variable, which then could live for up to Gyrs, depending on the white dwarf mass and the mass transfer rate from the secondary star. At present there seems to be a dearth of low-mass red giants in the Galactic Center. It has been suggested that encounters in the dense stellar environment may remove the giant envelope, and thus reduce the number of observable low-mass giants (Lacy et al. 1982; Genzel et al. 2010). Two processes are commonly thought to lead to the formation of a close binary system with a white dwarf primary: (1) standard common envelope evolution of an originally wide binary during the giant phase of the primary star (see e.g. Nelemans & Tout 2005); and (2) capture of a low-mass star in dense stellar environments by close encounters with the white dwarf. In the bulge of M31 the latter process, dynamical formation, is well documented for the overabundance of low-mass X-ray binaries (Voss & Gilfanov 2007), with a neutron star or stellar mass black hole primary instead of the white dwarf. Similarly, in the Galactic center Muno et al. (2005) found a 20-fold excess of X-ray transients in the central parsec with respect to the larger 10 parsec environment.
A particular channel in such environments, open only to white dwarf binary formation, is the tidal capture of a low-mass
star by the giant envelope of an evolved star that already has the degenerate core of white dwarf size at its center. The ensuing common envelope phase will form a pre-CV or CV type close binary, and, as discussed above, at the same time remove the original red giant from view. Such processes could then lead to significant overabundances of nova systems in the very central cusp of our galaxy.
8. Conclusions
We have investigated the possibility that the cloud observed by Gillessen et al. (2012) in the close neighborhood of the Galactic Center results from a nova outburst. Mass, velocities, and the presence of dust agree with those of observed nova shells. We find that simple examples for the orbits of ejected matter allow interpretation of the cloud head in its observed peculiar orbit around the Galactic center as part of the expanding shell of a nova that exploded around the year 2000. We note that different parts of a ring-like shell will appear at different brightness to the observer, the cloud head being the brightest one. The velocity with which the observed parts of the cloud structure, head and tail, move apart from each other, suggests that the tail is the, for the observer, second brightest part of the shell, ejected in the direction opposite to that of the head. The high eccentricity of the cloud head can be understood as caused by the addition of the velocities of the nova itself and the ejecta in that particular direction.
Though the nova origin model seems promising, it still needs further evaluation. We note a wide range of possible parameters for ejected nova shells and their orientation with respect to the observer, which could allow a detailed comparison of such a model with observations of that extraordinary cloud event.
References
- Burkert, A., Schartmann, M., Alig, C., et al. 2012, ApJ, 750, 58 [NASA ADS] [CrossRef] [Google Scholar]
- Downes, R. A., & Duerbeck, H. W. 2000, ApJ, 120, 2007 [Google Scholar]
- Ekström, S., Georgy, C., Eggenberger, P., et al. 2012, A&A, 537, A146 [NASA ADS] [CrossRef] [EDP Sciences] [Google Scholar]
- Evans, A., Tyne, V. H., Smith, O., et al. 2005, MNRAS, 360, 1483 [NASA ADS] [CrossRef] [Google Scholar]
- Genzel, R., Eisenhauer, P., & Gillessen, S. 2010, Rev. Mod. Phys., 82, 3121 [NASA ADS] [CrossRef] [Google Scholar]
- Gillessen, S., Eisenhauer, F., Tippe, S. et al. 2009, ApJ, 692, 1075 [NASA ADS] [CrossRef] [Google Scholar]
- Gillessen, S., Genzel, R., Fritz, T. K., et al. 2012, Nature, 481, 51 [NASA ADS] [CrossRef] [Google Scholar]
- Krautter, J., Woodward, C. E., Schuster, M. T., et al. 2002, AJ, 124, 2888 [NASA ADS] [CrossRef] [Google Scholar]
- Lacy, J. H., Townes, C. H., & Hollenbach, D. J. 1982, ApJ, 262, 120 [NASA ADS] [CrossRef] [Google Scholar]
- Miralda-Escudé, J. 2012, ApJ, 756, 86 [NASA ADS] [CrossRef] [Google Scholar]
- Muno, M. P., Pfahl, E., Baganoff, F. K., et al. 2005, ApJ, 622, L113 [NASA ADS] [CrossRef] [Google Scholar]
- Murray-Clay, R. A., & Loeb, A. 2012, Nature Comm., accepted [arXiv:1112.4822] [Google Scholar]
- Nelemans, G., & Tout, C. A. 2005, MNRAS, 356, 753 [NASA ADS] [CrossRef] [Google Scholar]
- O’Brian, T. J., & Bode, M. F. 2008, in Classical Novae, eds. M. Bode, & A. Evans, 2nd edn. (Cambridge: Cambridge University Press), 285 [Google Scholar]
- Schartmann, M., Burkert, A., Alig, C., et al. 2012, ApJ, 755, 155 [NASA ADS] [CrossRef] [Google Scholar]
- Shore, S. N. 2008, in Classical Novae, eds. M. Bode, & A. Evans, 2nd edn. (Cambridge: Cambridge University Press), 194 [Google Scholar]
- Slavin, A. J., O’Brian, T. J., & Dunlop, J. S. 1995, MNRAS, 276, 353 [NASA ADS] [CrossRef] [Google Scholar]
- Voss, R., & Gilfanov, M. 2007, MNRAS, 380, 1685 [NASA ADS] [CrossRef] [Google Scholar]
All Tables
All Figures
|
Fig. 1 Three orbits around the supermassive black hole at the Galactic Center. Red line: orbit of the cloud as determined in Gillessen et al. (2012) (taken from Schartmann et al. 2012, G2 in their Fig. 1), in our model interpreted as the inward ejecta of highest surface brightness for the observer. Black: the orbit of the nova that produced it. Blue: the orbit of the outward ejecta, which in projection are the highest surface brightness feature of the opposite ring region, identified with the tail. The years 2013.5, 2020.5, and 2012.1 denote the pericenters of the ellipses with quite different orientation and eccentricity, the cross denotes the position of the black hole. Dashed line: line of nodes, the intersection of the common plane of all orbits and the plane of sky, inclined to each other by a nearly right angle of i = 109.6°. See text. |
| In the text | |
Current usage metrics show cumulative count of Article Views (full-text article views including HTML views, PDF and ePub downloads, according to the available data) and Abstracts Views on Vision4Press platform.
Data correspond to usage on the plateform after 2015. The current usage metrics is available 48-96 hours after online publication and is updated daily on week days.
Initial download of the metrics may take a while.