Fig. 7
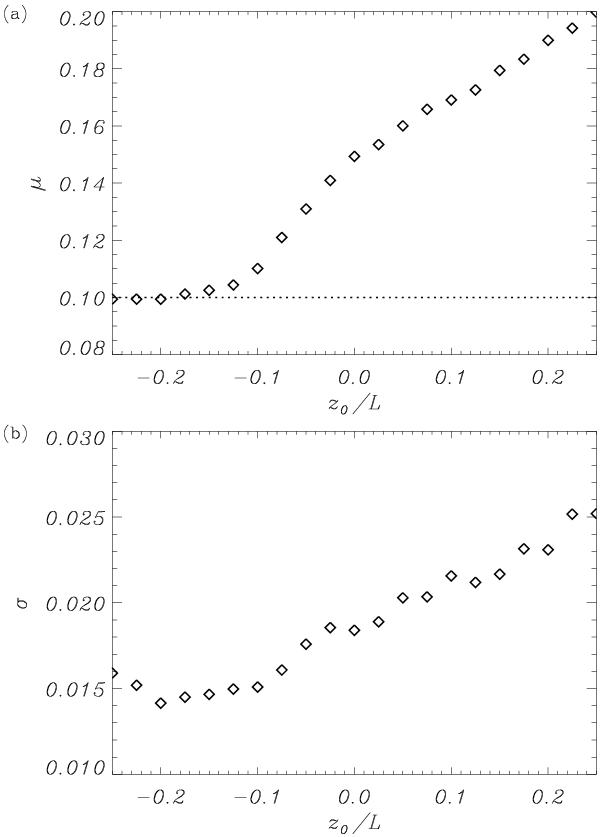
a) Mean value, μ, and b) standard deviation, σ, of the Gaussian distribution of seismologically estimated l/R as functions of z0/L. A maximum background noise of 50% and u0/cAp = 0.1 are used. The horizontal dotted line in panel a) shows the actual value of l/R.
Current usage metrics show cumulative count of Article Views (full-text article views including HTML views, PDF and ePub downloads, according to the available data) and Abstracts Views on Vision4Press platform.
Data correspond to usage on the plateform after 2015. The current usage metrics is available 48-96 hours after online publication and is updated daily on week days.
Initial download of the metrics may take a while.