Fig. 5
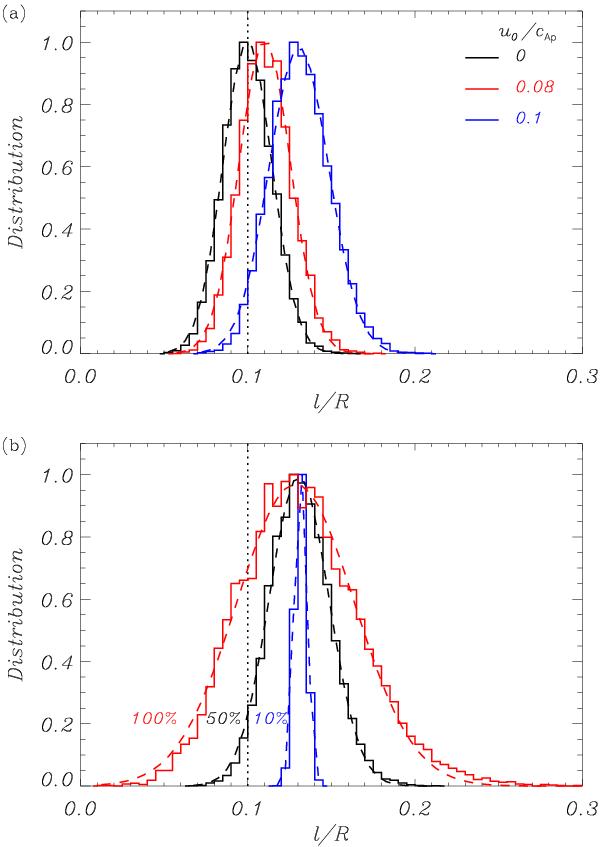
a) Normalized histogram of the seismologically estimated l/R for three values of the flow velocity (indicated within the panel) and a maximum background noise corresponding to 50% of the initial amplitude. b) Same as panel a) but with u0/cAp = 0.1 and three percentages of maximum background noise (indicated next to the lines). In both panels, the dashed lines are the Gaussian fits and the vertical dotted line is the actual l/R.
Current usage metrics show cumulative count of Article Views (full-text article views including HTML views, PDF and ePub downloads, according to the available data) and Abstracts Views on Vision4Press platform.
Data correspond to usage on the plateform after 2015. The current usage metrics is available 48-96 hours after online publication and is updated daily on week days.
Initial download of the metrics may take a while.