Fig. 4
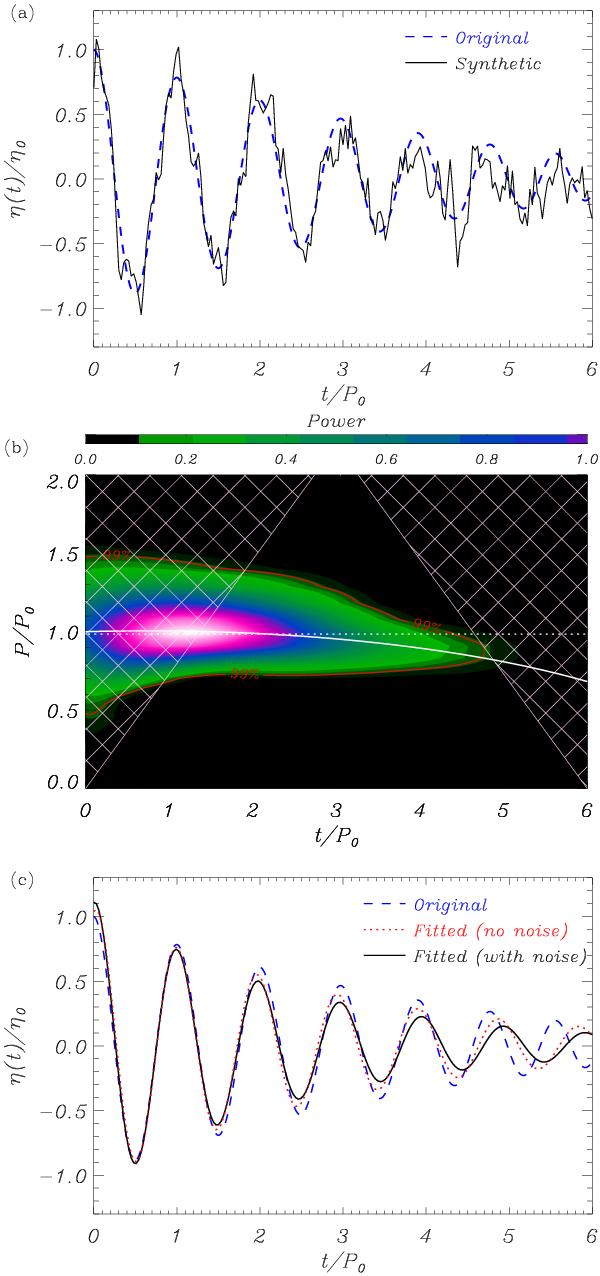
a) Original (dashed) and synthetic (solid) data used in the seismological test. b) Wavelet power spectrum for the dimensionless period, P/P0, corresponding to the synthetic signal displayed in panel a). The white solid line is the original data instantaneous period, whereas the horizontal dotted line is the period obtained from the fitting method. The red solid line denotes 99% of confidence level. c) Comparison of the original (dashed) and fitted signals with noise (solid) and without noise (dotted).
Current usage metrics show cumulative count of Article Views (full-text article views including HTML views, PDF and ePub downloads, according to the available data) and Abstracts Views on Vision4Press platform.
Data correspond to usage on the plateform after 2015. The current usage metrics is available 48-96 hours after online publication and is updated daily on week days.
Initial download of the metrics may take a while.