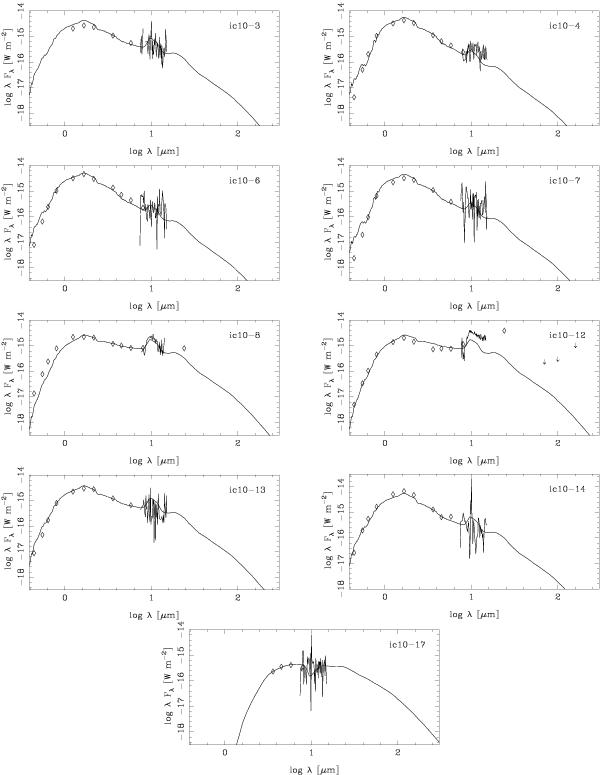
Fig. 9

SED fit results. For each source, the SED model is shown on top as the solid curve, with the diamonds indicating photometry points from the optical bands, 2MASS, and Spitzer, and with the segments indicating the IRS data. The [24] data point for source #8 bears significant uncertainties (see Table 3). The downward arrows for source #12 show the upper limits on the Herschel/PACS fluxes. Source #12 could not be fitted by our models (Sect. 6.1).
Current usage metrics show cumulative count of Article Views (full-text article views including HTML views, PDF and ePub downloads, according to the available data) and Abstracts Views on Vision4Press platform.
Data correspond to usage on the plateform after 2015. The current usage metrics is available 48-96 hours after online publication and is updated daily on week days.
Initial download of the metrics may take a while.


