Free Access
Fig. 5
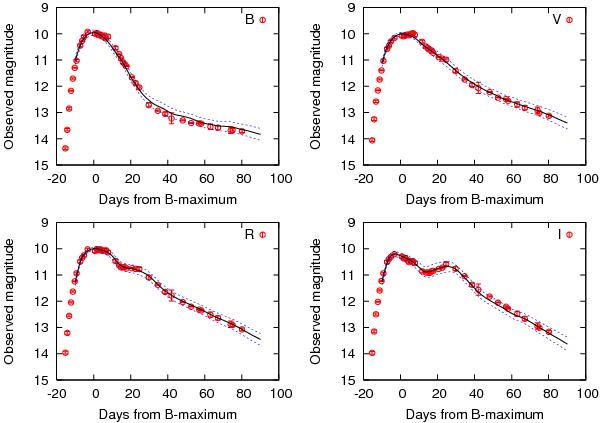
Fitting of the MLCS2k2 LCs to all observed data of SN 2011fe. Solid curves represent the best-fitting templates, while dotted curves denote the template uncertainties given by the time-dependent variance of each template curve.
Current usage metrics show cumulative count of Article Views (full-text article views including HTML views, PDF and ePub downloads, according to the available data) and Abstracts Views on Vision4Press platform.
Data correspond to usage on the plateform after 2015. The current usage metrics is available 48-96 hours after online publication and is updated daily on week days.
Initial download of the metrics may take a while.