Fig. 4
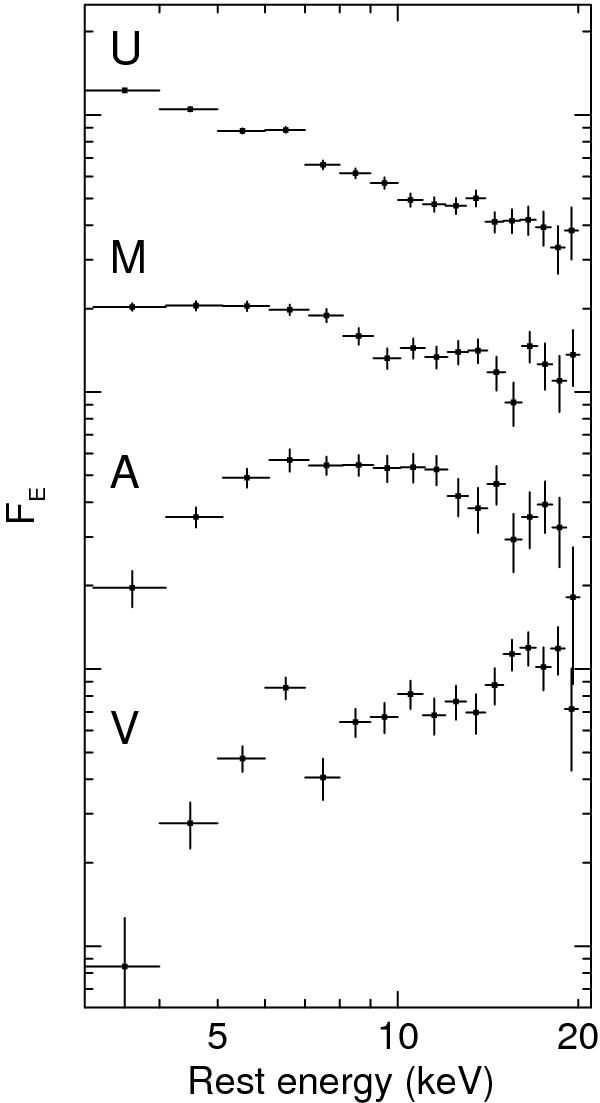
Rest-frame 3−20 keV stacked spectra for the four categories, defined in Fig. 3. The vertical axis is in arbitrary unit of flux density. Only the XMM-Newton data were used. The spectral stacking is a straight sum of individual sources while a weighted mean of the available EPIC data, based on the signal to noise ratio, is taken for each source. Number of sources, typical redshift and luminosity of each category can be found in Table 2. For a reference, the spectral slope of the U category spectrum is α ≃ 0.8, where FE ∝ E−α, i.e., photon index Γ ≃ 1.8.
Current usage metrics show cumulative count of Article Views (full-text article views including HTML views, PDF and ePub downloads, according to the available data) and Abstracts Views on Vision4Press platform.
Data correspond to usage on the plateform after 2015. The current usage metrics is available 48-96 hours after online publication and is updated daily on week days.
Initial download of the metrics may take a while.