Fig. 5
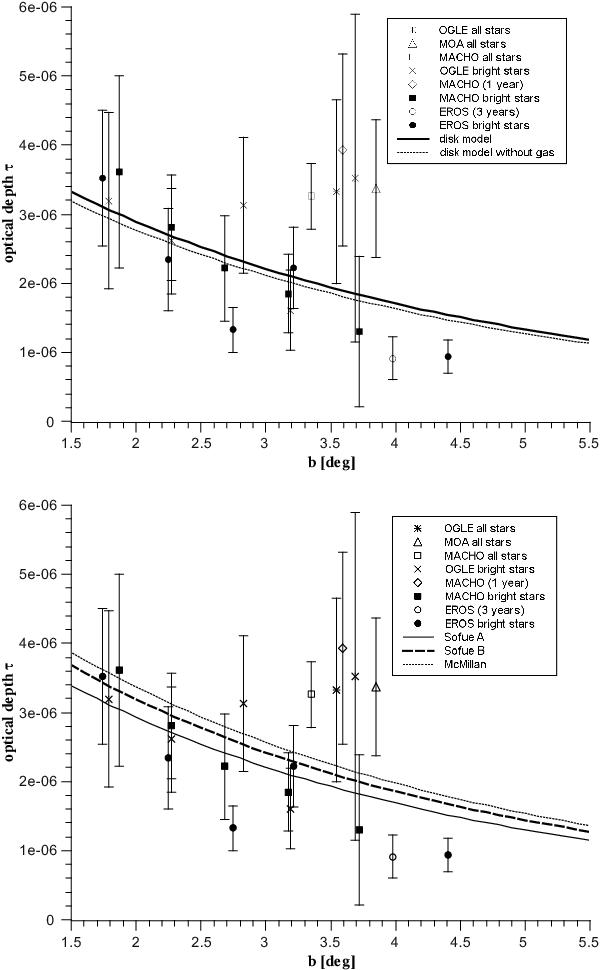
Optical depths in disk model with the disk scale height h = 325 pc. Points represent the observational data averaged over longitude within the range out to l = ± 5°. Top panel: the result for the rotation curve A (thick line) and after subtracting the gas contribution (thin line). Bottom panel: comparison of optical depths for different model rotation curves: A (solid line) and B (dashed line) and, in addition, the rotation curve based on the McMillan data (dotted line) (without gas subtraction and with R° = 8.29 kpc preferred by McMillan).
Current usage metrics show cumulative count of Article Views (full-text article views including HTML views, PDF and ePub downloads, according to the available data) and Abstracts Views on Vision4Press platform.
Data correspond to usage on the plateform after 2015. The current usage metrics is available 48-96 hours after online publication and is updated daily on week days.
Initial download of the metrics may take a while.