Fig. 11
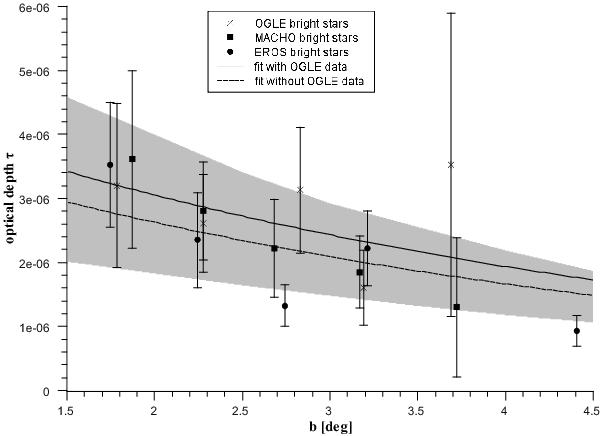
(1 − f) c1exp(−c2|b|) × 10-6 fit to the OGLE, MACHO, and EROS bright stars optical depth data (solid line) and a similar fit to the narrowed data of MACHO and EROS bright stars data (dashed line). The filled area corresponds to the standard deviation range of the Monte Carlo simulation (including bar) described in the previous section. The c1exp(−c2|b|) × 10-6 curve is not plotted for clarity.
Current usage metrics show cumulative count of Article Views (full-text article views including HTML views, PDF and ePub downloads, according to the available data) and Abstracts Views on Vision4Press platform.
Data correspond to usage on the plateform after 2015. The current usage metrics is available 48-96 hours after online publication and is updated daily on week days.
Initial download of the metrics may take a while.