Fig. 8
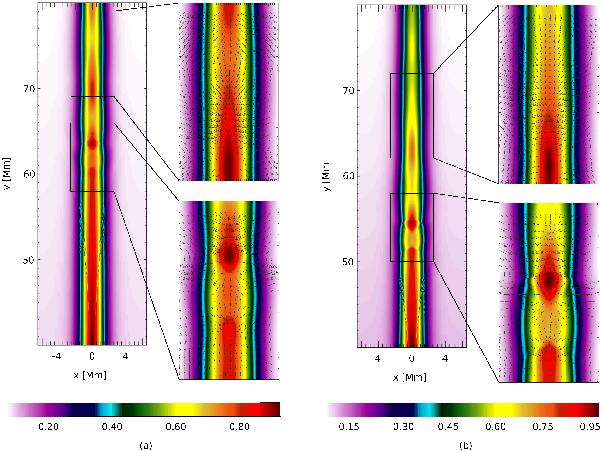
Spatial profiles of the mass density close to the area of the detection points with zoomed areas at t = 100 s for the case of the gravitationally stratified solar corona. The left part a) corresponds to the longer scale-height whereas the right part b) of the figure shows the area for the shorter scale-height. The black arrows represent the plasma velocity vectors. The mass density is expressed by colors which correspond to the ratio of the local mass density to that in the perturbation point, LP, in the initial time.
Current usage metrics show cumulative count of Article Views (full-text article views including HTML views, PDF and ePub downloads, according to the available data) and Abstracts Views on Vision4Press platform.
Data correspond to usage on the plateform after 2015. The current usage metrics is available 48-96 hours after online publication and is updated daily on week days.
Initial download of the metrics may take a while.