Fig. 5
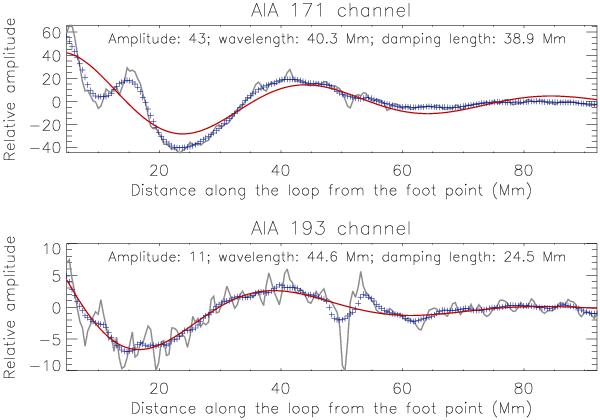
Top: solid line in grey represents the intensity values along the loop, relative to the background, averaged over three successive time frames in 171 Å channel. Plus symbols in blue are the 10 point (≈4.3 Mm) smooth averages of these values. The damping sine curve fitted to these smoothed values is overplotted as a red solid line. Obtained fit parameters are labelled. Bottom: similar curves and values generated from the 193 Å channel.
Current usage metrics show cumulative count of Article Views (full-text article views including HTML views, PDF and ePub downloads, according to the available data) and Abstracts Views on Vision4Press platform.
Data correspond to usage on the plateform after 2015. The current usage metrics is available 48-96 hours after online publication and is updated daily on week days.
Initial download of the metrics may take a while.