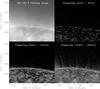
Fig. 2
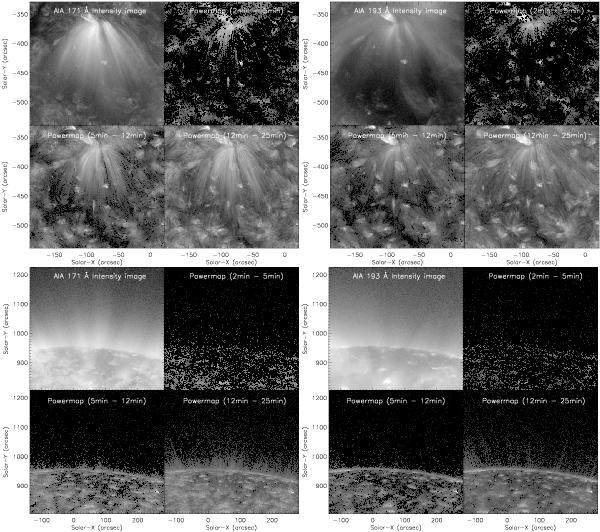
Top row: powermaps constructed in different periodicity ranges for the on-disk plume structure in 171 Å (left) and 193 Å (right) channels of AIA. The intensity image is shown in the top left panels. All powermaps show the total significant power above the 99% confidence level in the periodicity limits. Bottom row: same, but for the north polar region.
Current usage metrics show cumulative count of Article Views (full-text article views including HTML views, PDF and ePub downloads, according to the available data) and Abstracts Views on Vision4Press platform.
Data correspond to usage on the plateform after 2015. The current usage metrics is available 48-96 hours after online publication and is updated daily on week days.
Initial download of the metrics may take a while.