Fig. 2
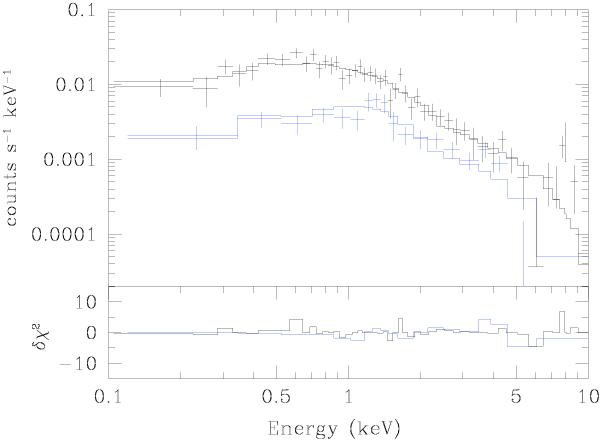
Best-fit absorbed power-law model (see Table 1) of the X-ray spectrum of the blazar BZQ J1049+3737. The black and blue data points refer to the pn and MOS2 data, respectively. The lower panel shows the contribution of the various energy bins to the χ2 of the fit times the sign of the difference between the data and the model.
Current usage metrics show cumulative count of Article Views (full-text article views including HTML views, PDF and ePub downloads, according to the available data) and Abstracts Views on Vision4Press platform.
Data correspond to usage on the plateform after 2015. The current usage metrics is available 48-96 hours after online publication and is updated daily on week days.
Initial download of the metrics may take a while.