Fig. 9
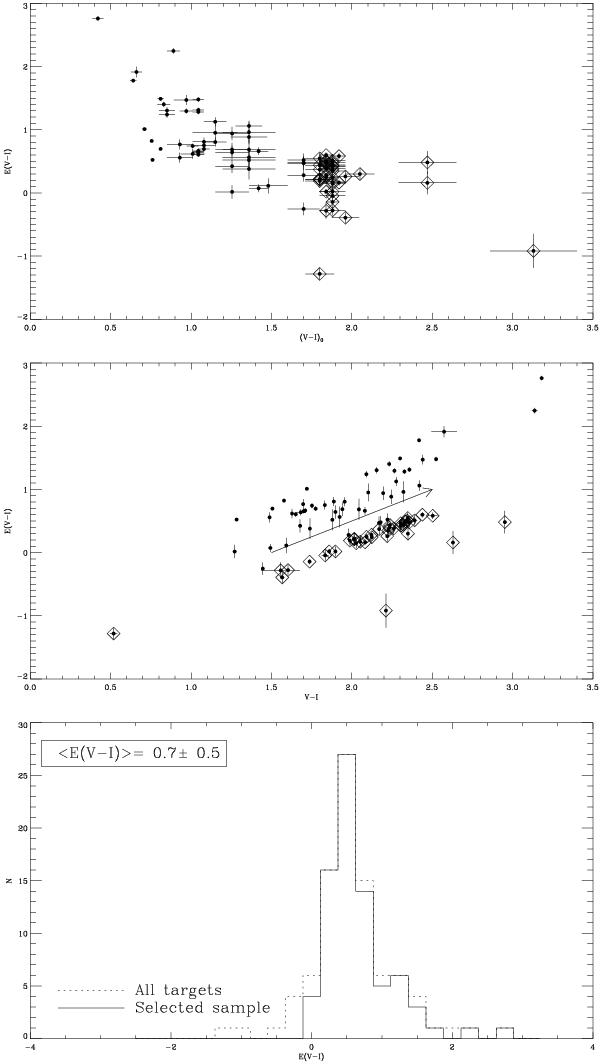
E(V − I) vs. intrinsic (V − I)0 (top panel) and vs. observed (V − I) (middle panel). Objects indicated by empty diamonds are M0 or later stars. The reddening vector corresponding to E(V − I) = 1 is also plotted. E(V − I) distribution (bottom panel) obtained by considering all targets (dotted line) and the selected sample including the 70 cluster members with E(V − I) > 0 and without special photometric or spectroscopic features indicated in Table 3.
Current usage metrics show cumulative count of Article Views (full-text article views including HTML views, PDF and ePub downloads, according to the available data) and Abstracts Views on Vision4Press platform.
Data correspond to usage on the plateform after 2015. The current usage metrics is available 48-96 hours after online publication and is updated daily on week days.
Initial download of the metrics may take a while.