Free Access
Fig. 1
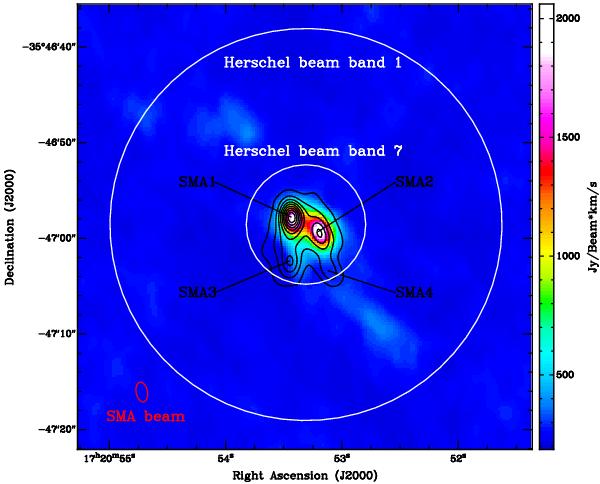
Integrated SMA line intensity map over all species. Overlaid in black contours is the continuum emission. The contour levels are from 90% to 10% of the maximum in steps of 10%. The large and small white circles represent the FWHM Herschel beam size for band 1 and band 7, respectively.
Current usage metrics show cumulative count of Article Views (full-text article views including HTML views, PDF and ePub downloads, according to the available data) and Abstracts Views on Vision4Press platform.
Data correspond to usage on the plateform after 2015. The current usage metrics is available 48-96 hours after online publication and is updated daily on week days.
Initial download of the metrics may take a while.