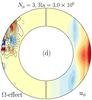
Fig. 6
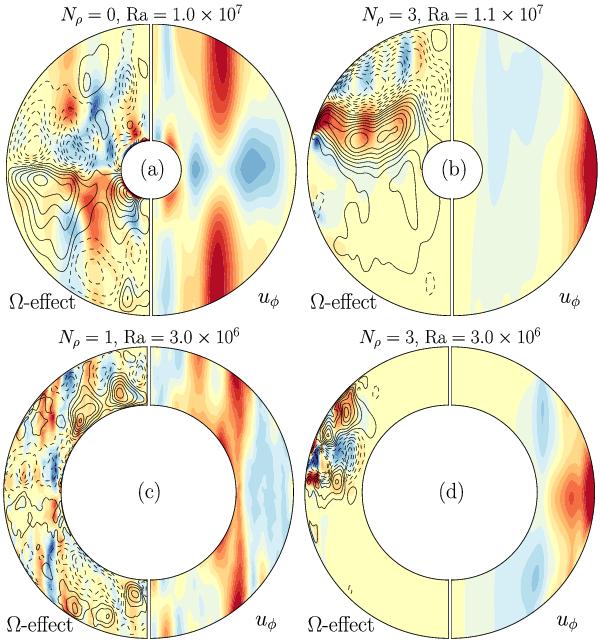
Role of the Ω-effect in the production of the toroidal field for two selected simulations in thick shells (upper panels) and in thin shells (lower panel). For each simulation, the Ω-effect (colour levels) and the axisymmetric azimuthal field (solid and dashed lines) are displayed on the left part, while the axisymmetric zonal flow is given on the right part. Red (blue) corresponds to positive (negative) values.
Current usage metrics show cumulative count of Article Views (full-text article views including HTML views, PDF and ePub downloads, according to the available data) and Abstracts Views on Vision4Press platform.
Data correspond to usage on the plateform after 2015. The current usage metrics is available 48-96 hours after online publication and is updated daily on week days.
Initial download of the metrics may take a while.