Fig. 2
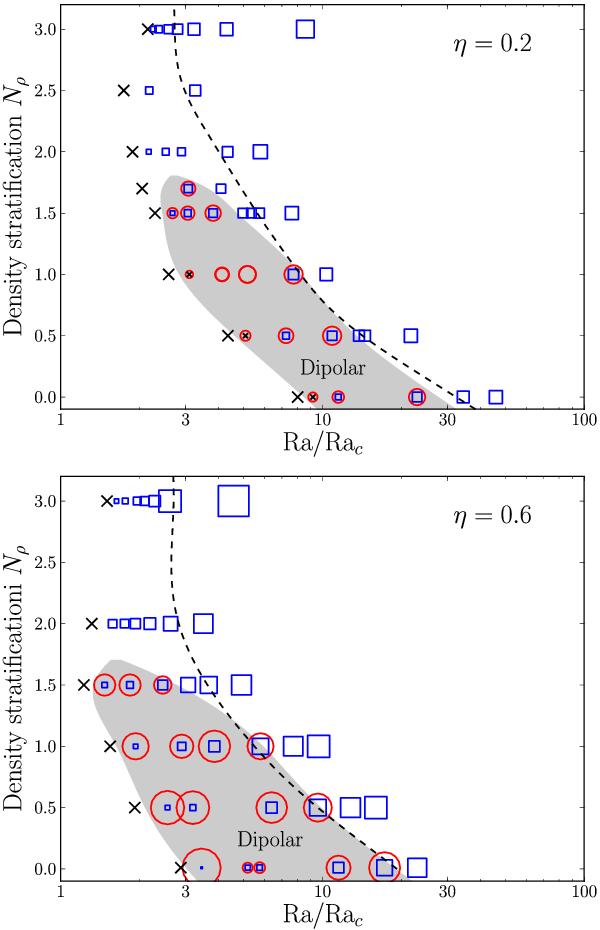
Regime diagram for dynamo simulations as a function of supercriticality and density stratification for two different aspect ratios: η = 0.2 (upper panel) and η = 0.6 (lower panel). Red circles correspond to dipolar dynamos, blue squares to multipolar dynamos, and black crosses are decaying dynamos. The size of the symbols depends on the value of the modified Elsasser number (Eq. (13)). The grey-shaded area highlights the dipolar region, while the dashed lines correspond to the critical Roℓc values that mark the limit between dipolar and multipolar dynamos (see the vertical lines in Fig. 1).
Current usage metrics show cumulative count of Article Views (full-text article views including HTML views, PDF and ePub downloads, according to the available data) and Abstracts Views on Vision4Press platform.
Data correspond to usage on the plateform after 2015. The current usage metrics is available 48-96 hours after online publication and is updated daily on week days.
Initial download of the metrics may take a while.