Fig. 1
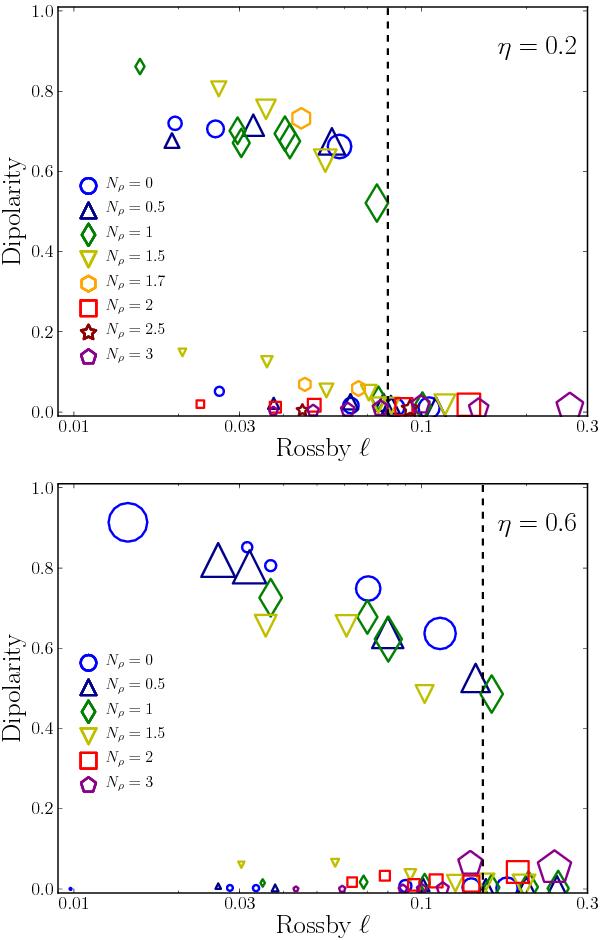
Relative dipole strength plotted against the local Rossby number Roℓ for two different aspect ratios: η = 0.2 (upper panel) and η = 0.6 (lower panel). Each type of symbol is associated to a specific density stratification (from Boussinesq, i.e. Nρ = 0 to stratified simulations corresponding to Nρ = 3). The size of the symbol was chosen according to the value of the modified Elsasser number (Eq. (13)). Vertical lines are tentative transitions between dipolar and multipolar dynamos.
Current usage metrics show cumulative count of Article Views (full-text article views including HTML views, PDF and ePub downloads, according to the available data) and Abstracts Views on Vision4Press platform.
Data correspond to usage on the plateform after 2015. The current usage metrics is available 48-96 hours after online publication and is updated daily on week days.
Initial download of the metrics may take a while.