Fig. 6
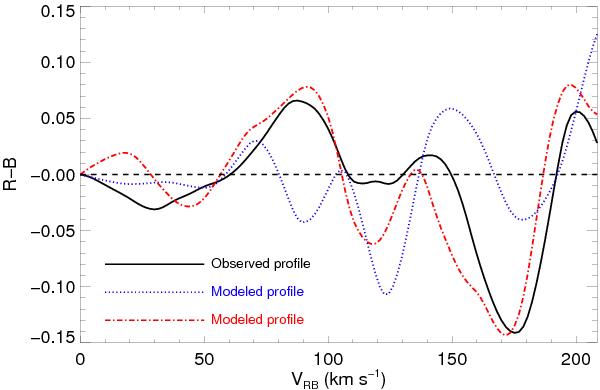
Variation of the R − B asymmetry of line profiles with velocities measured from the respective line centroid (VRB). The continuous black curve is obtained from the observed profile of Ne viii 770 Å shown in the first bottom panel of Fig. 5. The red and blue curves are obtained from the simulated profile modeled with a single Gaussian and a constant background (with parameters similar to the observed profile) but sampled differently with respect to the line centroid. The red curve represents the case of maximum asymmetry in sampling (about half a pixel shift from the line centroid) while the blue curve is sampled symmetrically and therefore shows just the effects of noise.
Current usage metrics show cumulative count of Article Views (full-text article views including HTML views, PDF and ePub downloads, according to the available data) and Abstracts Views on Vision4Press platform.
Data correspond to usage on the plateform after 2015. The current usage metrics is available 48-96 hours after online publication and is updated daily on week days.
Initial download of the metrics may take a while.