Fig. 2
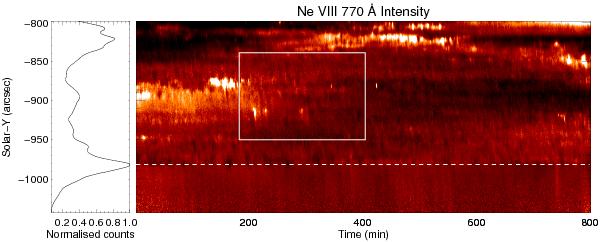
Left panel: the normalized time-averaged intensity variation along the slit. Right panel: the intensity variation along solar-Y with time, which is normalized by the time-averaged intensity variation along the slit. The white dashed line marks the location of maximum limb brightening, whereas the continuous box indicates the region chosen for detailed analysis.
Current usage metrics show cumulative count of Article Views (full-text article views including HTML views, PDF and ePub downloads, according to the available data) and Abstracts Views on Vision4Press platform.
Data correspond to usage on the plateform after 2015. The current usage metrics is available 48-96 hours after online publication and is updated daily on week days.
Initial download of the metrics may take a while.