Fig. 9
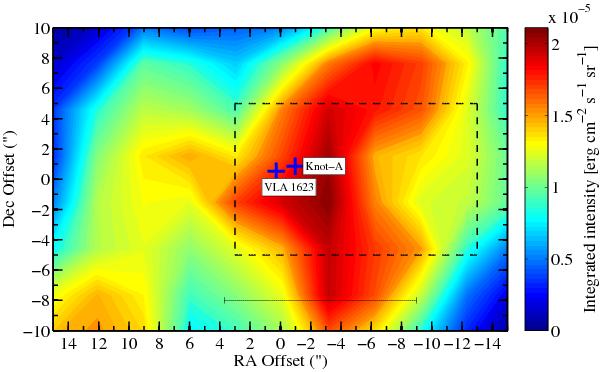
Colour map showing the H2O (212 − 101) emission observed with PACS. The dashed region indicates the coverage of the SMA, 1.3 mm continuum map presented in Maury et al. (2012, their Fig. 1). The position of the Class 0 source and Knot-A, discussed in that paper, are indicated with blue crosses. The horizontal bar indicates the beam size of Herschel at 1670 GHz.
Current usage metrics show cumulative count of Article Views (full-text article views including HTML views, PDF and ePub downloads, according to the available data) and Abstracts Views on Vision4Press platform.
Data correspond to usage on the plateform after 2015. The current usage metrics is available 48-96 hours after online publication and is updated daily on week days.
Initial download of the metrics may take a while.