Fig. 8
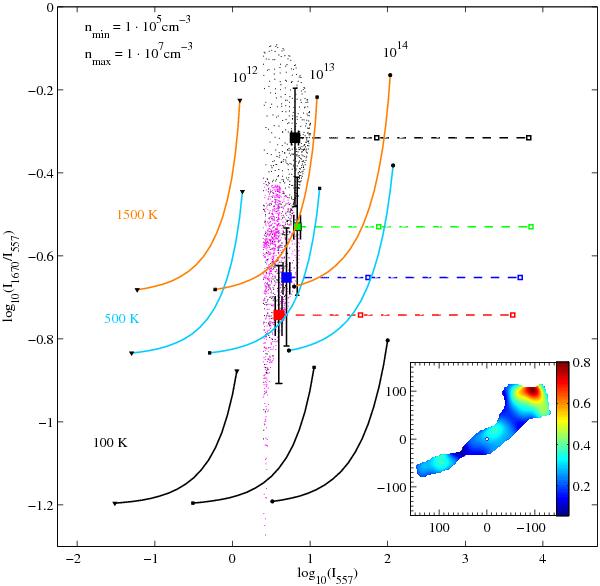
Integrated line strengths as a function of density, temperature and o-H2O column density. The resolution of the PACS (1670 GHz) data has been degraded to match the resolution of the HIFI (557 GHz) data. The black, cyan and orange curves show the line ratio as a function of increasing o-H2O column density (from 1012 to 1014 cm-2) for three different values on the kinetic temperature of the gas (100, 500, and 1500 K). The lowest column density is to the left in this figure. Within each curve the density of the gas varies from 105 cm-3 to 107 cm-3 (from left to right). The observed beam averaged values are plotted with coloured squares. Red is towards the position of R2, blue is towards B1, black is towards GSS 30, and green is towards VLA 1623. The dashed lines represent the same regions for smaller source sizes where consecutive squares indicate source sizes of 10′′, and 1′′. Black and purple dots represent observed ratios towards the region close to GSS 30 and the outflow respectively, i.e. where  K km s-1. The inset in the lower right corner shows the line ratio over the map on a linear scale. Here, the offsets are with respect to VLA1623.
Current usage metrics show cumulative count of Article Views (full-text article views including HTML views, PDF and ePub downloads, according to the available data) and Abstracts Views on Vision4Press platform.
Data correspond to usage on the plateform after 2015. The current usage metrics is available 48-96 hours after online publication and is updated daily on week days.
Initial download of the metrics may take a while.