Free Access
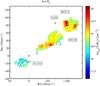
Fig. 7
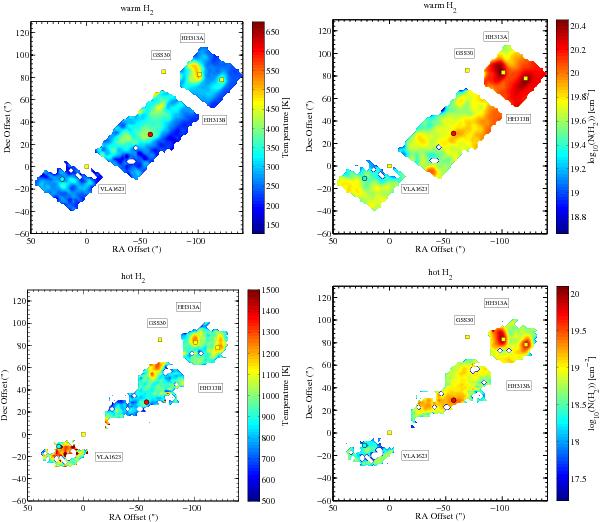
Left panels: temperature of the warm and hot gas, i.e. the low and high temperature components from the H2 rotational diagrams (see text). Right panels: column density of the warm and hot H2 gas. In all panels, the positions of R2, B1, VLA 1623, GSS30, HH 313 A and HH 313 B are indicated with coloured dots.
This figure is made of several images, please see below:
Current usage metrics show cumulative count of Article Views (full-text article views including HTML views, PDF and ePub downloads, according to the available data) and Abstracts Views on Vision4Press platform.
Data correspond to usage on the plateform after 2015. The current usage metrics is available 48-96 hours after online publication and is updated daily on week days.
Initial download of the metrics may take a while.