Fig. 6
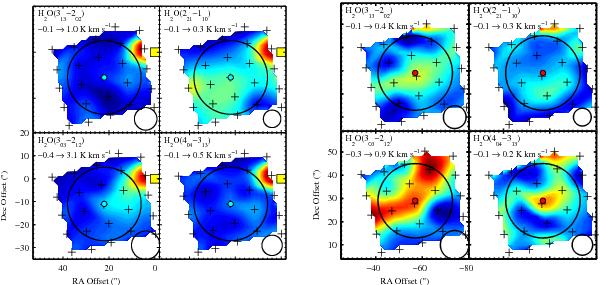
Observed PACS lines towards the B1 (left panel) and R2 (right panel) positions. The blue and red dots indicate the positions of B1 and R2 and the plus signs represent the pointing of each of the 25 spaxels. In the upper left corner of each figure, the line and the range of the colour scale is indicated. Beam sizes are indicated in the lower right corners and the 32′′ circular region where the line flux has been averaged is visualised with a black circle. In the left panel, part of the line emission originating in the region close to VLA 1623 (yellow square) is picked up in the nearby spaxel.
Current usage metrics show cumulative count of Article Views (full-text article views including HTML views, PDF and ePub downloads, according to the available data) and Abstracts Views on Vision4Press platform.
Data correspond to usage on the plateform after 2015. The current usage metrics is available 48-96 hours after online publication and is updated daily on week days.
Initial download of the metrics may take a while.