Fig. 4
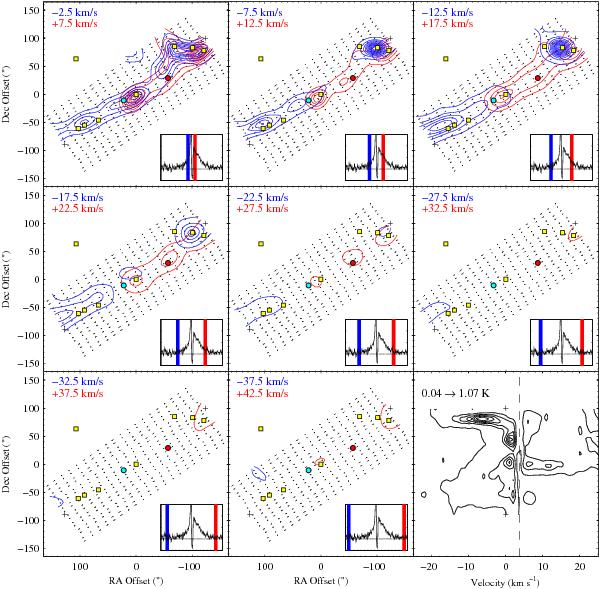
Integrated H2O (110 − 101) intensities in different velocity intervals where Δυ = 5 km s-1. The center velocity of the bins is indicated in each panel. Contours are in steps of 0.15 K km s-1 and the first contour is at 0.1 K km s-1 for all maps except the two maps at lowest velocity, where the first contour is at 0.3 K km s-1 and the contour interval is 0.3 K km s-1. High velocity gas (υLSR > 35 km s-1) is observed both close to the central source and further out in the flow. The readout positions for the OTF map are indicated with black dots. The squares and circles represent the positions of the sources presented in Fig. 2. The insets in the lower right corners illustrate each velocity interval for the spectrum towards VLA 1623. The lower right panel shows the position-velocity map in the direction connecting the two plus signs. Here, υLSR = 3.7 km s-1 is indicated with a dashed line.
Current usage metrics show cumulative count of Article Views (full-text article views including HTML views, PDF and ePub downloads, according to the available data) and Abstracts Views on Vision4Press platform.
Data correspond to usage on the plateform after 2015. The current usage metrics is available 48-96 hours after online publication and is updated daily on week days.
Initial download of the metrics may take a while.